Veles ZigZag X

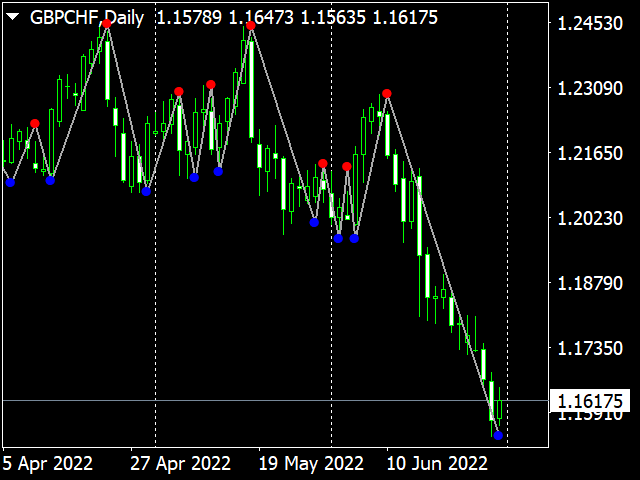
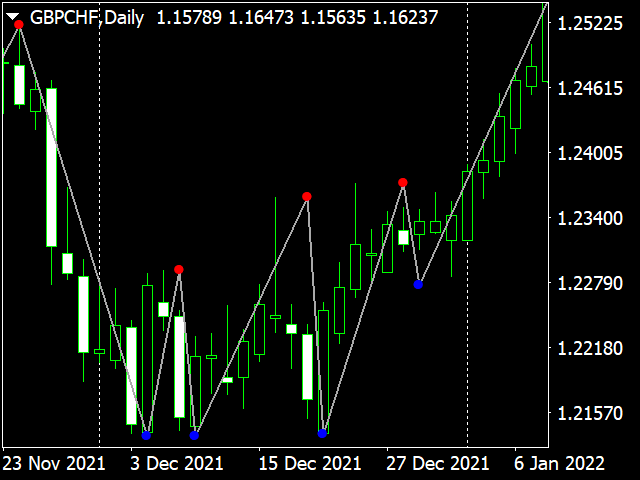
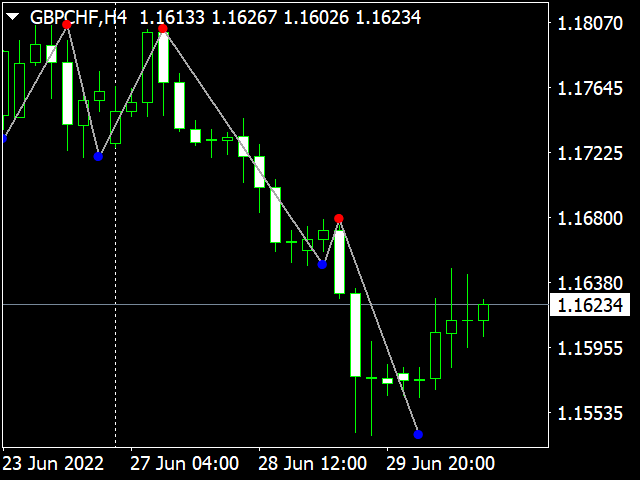
Очень точный индикатор, с его помощью очень легко определять барные паттерны.
Это очередная разновидность ЗигЗага, за исключением, он не рисует текущую линию, которая может перерисоваться,если нарисовал конечную точку, по закрытому бару, то больше ее не изменяет - это означает смену направления и следующая точка будет другого цвета. Может быть применен как для определения основного движения, при использовании увеличенных параметров, так и непосредственно для входа с минимальным риском. Очень хорошо показывает все волны. Работает с любым инструментом и любым ТаймФреймом.

Параметры как у стандартного ЗигЗага.


Produits recommandés
The indicator detects and displays Shark harmonic pattern (see the screenshot). The pattern is plotted by the extreme values of the ZigZag indicator (included in the resources, no need to install). After detecting the pattern, the indicator notifies of that by a pop-up window, a mobile notification and an email. The indicator highlights the process of the pattern formation and not just the complete pattern. In the former case, it is displayed in the contour triangles. After the pattern is comple
Double HMA lines MTF
Pavel Zamoshnikov
5 (1)
This is a multi-timeframe version of the popular Hull Moving Average (HMA). The Double HMA MTF Light indicator combines two timeframes on a single chart. The HMA of the higher timeframe defines the trend, and the HMA of the current timeframe defines short-term price movements. The indicator is freely distributed and hasn't audio signals or messages. Its main function is the visualization of price movements. If you need advanced functionality of the HMA multi-timeframe indicator (information ab
FREE
The indicator detects and displays 3 Drives harmonic pattern (see the screenshot). The pattern is plotted by the extreme values of the ZigZag indicator (included in the resources, no need to install). After detecting the pattern, the indicator notifies of that by a pop-up window, a mobile notification and an email. The indicator highlights the process of the pattern formation and not just the complete pattern. In the former case, it is displayed in the contour triangles. After the pattern is com
The indicator detects and displays М. Gartley's Butterfly pattern. The pattern is plotted by the extreme values of the ZigZag indicator (included in the resources, no need to install). After detecting the pattern, the indicator notifies of that by the pop-up window, a mobile notification and an email. The pattern and wave parameters are displayed on the screenshots. The default parameters are used for demonstration purposes only in order to increase the amount of detected patterns. Parameters z
"Auto FIBO Pro" Crypto_Forex indicator - est un excellent outil auxiliaire dans le trading ! - L'indicateur calcule et place automatiquement sur le graphique les niveaux de Fibo et les lignes de tendance locales (couleur rouge). - Les niveaux de Fibonacci indiquent les zones clés où le prix peut s'inverser. - Les niveaux les plus importants sont 23,6 %, 38,2 %, 50 % et 61,8 %. - Vous pouvez l'utiliser pour le scalping inversé ou pour le trading en grille de zones. - Il existe également de nomb
Trend Ray
Andriy Sydoruk
The indicator shows the potential trend direction by cyclical-wave dependence. Thus, all the rays of the intersection will be optimal rays, in the direction of which the price is expected to move, taking into account the indicator period. Rays can be used as a direction for potential market movement. But we must not forget that the approach must be comprehensive, the indicator signals require additional information to enter the market.
Rainbow Price Visualizer v1.21 See where the market really breathes. Turns your MT4 chart into an ultra-precise heatmap that highlights price zones favored by big players. Why it matters 300 price levels at 0.2‑pip resolution — microscopic detail. 8 visual themes (Rainbow, Fire, Ocean…) for instant readibility. Smart opacity: low noise fades, real zones pop. Lightweight rendering with automatic cleanup. Fully customizable: saturation, opacity, resolution, history depth. Bands project into the f
Alpha Trend sign est notre outil de Trading très populaire depuis longtemps, il valide notre système de Trading et invite clairement les signaux de Trading sans dérive. Fonctions principales: • En fonction de la zone active du marché, selon les indicateurs, il est intuitif de déterminer si le cours actuel appartient à la tendance ou à la tendance. Et coupez le marché selon les flèches d'indication de l'indicateur, les flèches vertes suggèrent d'acheter et les flèches rouges suggèrent de vend
FlatBreakout
Aleksei Vorontsov
FlatBreakout (Free Version) Flat Range Detector and Breakout Panel for MT4 — GBPUSD Only FlatBreakout is the free version of the professional FlatBreakoutPro indicator, specially designed for flat (range) detection and breakout signals on the GBPUSD pair only. Perfect for traders who want to experience the unique fractal logic of FlatBreakout and test breakout signals on a live market without limitations. Who Is This Product For? For traders who prefer to trade breakout of flat ranges (breakout,
FREE
"Adjustable Fractals" - est une version avancée de l'indicateur fractal, un outil de trading très utile ! - Comme nous le savons, l'indicateur fractal standard MT4   n'a aucun paramètre - c'est très gênant pour les traders. - Les fractales ajustables ont résolu ce problème - il dispose de tous les paramètres nécessaires : - Période réglable de l'indicateur (valeurs recommandées - supérieures à 7). - Distance réglable par rapport aux hauts/bas du prix. - Conception réglable des flèches fractale
"Adjustable Fractals Pro" - est une version avancée de l'indicateur fractal, un outil de trading très utile ! - Comme nous le savons, l'indicateur fractal standard mt4 n'a aucun paramètre - ce qui est très gênant pour les traders. - Adjustable Fractals Pro a résolu ce problème - il dispose de tous les paramètres nécessaires : - Période réglable de l'indicateur (valeurs recommandées - supérieures à 7). - Distance réglable par rapport aux hauts/bas du prix. - Conception réglable des flèches frac
Wise Men Indicator demo
Bohdan Kasyanenko
3 (2)
The indicator displays signals according to the strategy of Bill Williams on the chart. Demo version of the indicator has the same features as the paid, except that it can work only on a demo account . Signal "First Wise Man" is formed when there is a divergent bar with angulation.  Bullish divergent bar - with lower minimum and closing price in the upper half. Bearish divergent bar - higher maximum and the closing price at the bottom half. Angulation is formed when all three lines of Alligator
FREE
Trend Scanner
Vladimir Kalendzhyan
4.33 (6)
By purchasing this indicator, you have the right to receive a free copy of one of   my other indicator's or advisor’s!  (All future updates are included. No limits) . To get it , please contact me by  mql5 message ! The Trend Scanner trend line indicator displays the trend direction and its changes. The indicator works on all currency pairs and  timeframes. The indicator simultaneously displays multiple readings on the price chart: the support and resistance lines of the currency pair, the exist
Price Magnet — Price Density and Attraction Levels Indicator Price Magnet is a professional analytical tool designed to identify key support and resistance levels based on statistical Price Density. The indicator analyzes a specified historical period and detects price levels where the market spent the most time. These zones act as “magnets,” attracting price action or forming a structural base for potential reversals. Unlike traditional Volume Profile tools, Price Magnet focuses on price-time d
Trend PA
Mikhail Nazarenko
5 (3)
The Trend PA indicator uses   Price Action   and its own filtering algorithm to determine the trend. This approach helps to accurately determine entry points and the current trend on any timeframe. The indicator uses its own algorithm for analyzing price changes and Price Action. Which gives you the advantage of recognizing, without delay, a new nascent trend with fewer false positives. Trend filtering conditions can be selected in the settings individually for your trading style. The indicator
Extremum Reverse Bar
Yurij Izyumov
2.8 (5)
This indicator has been created for finding the probable reversal points of the symbol price. A small candlestick reversal pattern is used it its operation in conjunction with a filter of extremums. The indicator is not redrawn! If the extremum filter is disabled, the indicator shows all points that have a pattern. If the extremum filter is enabled, the condition works – if the history Previous bars 1 candles back contains higher candles and they are farther than the Previous bars 2 candle, such
FREE
Candle Countdown — Temps précis jusqu’à la clôture de la bougie pour MT4 Candle Countdown est un outil simple et précis qui affiche le temps restant avant la clôture de la bougie actuelle directement sur le graphique. Lorsque l’entrée dépend de la clôture de la bougie, même quelques secondes peuvent faire la différence. Cet indicateur vous permet de voir l’heure exacte et de prendre des décisions sans précipitation ni suppositions. Un indicateur pour un contrôle précis de la clôture des bougies
FREE
Free automatic Fibonacci is an indicator that automatically plots a Fibonacci retracement based on the number of bars you select on the BarsToScan setting in the indicator. The Fibonacci is automatically updated in real time as new highest and lowest values appears amongst the selected bars. You can select which level values to be displayed in the indicator settings. You can also select the color of the levels thus enabling the trader to be able to attach the indicator several times with differe
FREE
Ppr PA
Yury Emeliyanov
4.75 (4)
"Ppr PA" is a unique technical indicator created to identify "PPR" patterns on the currency charts of the MT4 trading platform. These patterns can indicate possible reversals or continuation of the trend, providing traders with valuable signals to enter the market. Features: Automatic PPR Detection:   The indicator automatically identifies and marks PPR patterns with arrows on the chart. Visual Signals:   Green and red arrows indicate the optimal points for buying and selling, respectively. Ar
FREE
Aroon Classic
Etsushi Ishizuka
Vue d’ensemble de l’indicateur Aroon Classic L’indicateur Aroon Classic est un outil technique qui identifie quantitativement l’apparition et la persistance des tendances sur un graphique. Il utilise deux lignes — « Aroon Up » et « Aroon Down » — pour afficher la force de la tendance et les points de retournement dans une plage de 0 à 100. Une valeur élevée de Aroon Up indique une forte tendance haussière, tandis qu’une valeur élevée de Aroon Down indique une forte tendance baissière. Principale
FREE
The   Trendlines Oscillator   helps traders identify trends and momentum based on the normalized distances between the current price and the most recently detected bullish and bearish trend lines. The indicator features bullish and bearish momentum, a signal line with crossings, and multiple smoothing options. USAGE The   Trendlines Oscillator   works by systematically: Identifying pivot highs and lows. Connecting pivots to form bullish (support) and bearish (resistance) trendlines. Measuring
PZ Penta O MT4
PZ TRADING SLU
2.33 (3)
The Penta-O is a 6-point retracement harmonacci pattern which usually precedes big market movements. Penta-O patterns can expand and repaint quite a bit. To make things easier this indicator implements a twist: it waits for a donchian breakout in the right direction before signaling the trade. The end result is an otherwise repainting indicator with a very reliable trading signal. The donchian breakout period is entered as an input. [ Installation Guide | Update Guide | Troubleshooting | FAQ | A
FREE
LordChannel
Igor Pereira Calil
LordChannel is an indicator for META TRADER 4 for all forex pairs and financial market metals. The indicator is used to make detections of high/low channels, implementing a technical analysis on possible breakouts and making correct order entries. LordChannel sends signals such as buy and sell in the graphical analysis, it is important to emphasize that the importance of these signals are safe in TIME FRAMES M30, H1, H4. The indicator was created for using bullish/downtrend channels to compl
Support and Resistance Channels
Hossam Mohamed Abdelsalam Ahmed Abdelsalam
Support and Resistance technical indicator for mt4 that identifies the Strong support and resistance levels based on  Zigzag indicator with full control of Zigzag indicator setting , selectable Timeframes  as well as  SRL lines formats . Inputs: - Time frame. ----------------- Zigzag setting: ------------------ - Depth. - Deviation. - Backstep. -------------------- Peaks and valleys setting: - Min peaks gap in Points. // to be considered as a new level. - Peak sensitivity. // min no. of peaks t
This indicator is the undisputed leader among the indicators. And for this statement there is a good reason. The indicator builds a very high quality channel in which it generates signals to enter! What is the ideal strategy for the trader, since the trader always hesitates when choosing a strategy for the job. That is, this indicator will allow you to solve the dilemma of choosing a job by trend or to the channel, since it combines these two basic concepts. Working with the indicator is very
KDJ Index 4   交易实用必备工具指标 波浪自动计算指标,通道趋势交易 完美的趋势-波浪自动计算通道计算 , MT4版本 完美的趋势-波浪自动计算通道计算 , MT5版本 本地跟单复制交易 Easy And Fast Copy , MT4版本 Easy And Fast Copy , MT5版本 本地跟单复制交易 模拟试用 Easy And Fast Copy , MT4 模拟账号运行 Easy And Fast Copy , MT5 模拟账号运行 "Cooperative QQ:556024  "  "Cooperation wechat:556024"  "Cooperative email:556024@qq.com" 强烈推荐趋势指标, 波浪的标准自动计算   和   波浪的标准自动计算MT5版本     KDJ指标又叫 随机指标 ,是一种相当新颖、实用的技术分析指标,它起先用于期货市场的分析,后被广泛用于股市的中短期趋势分析,是期货和股票市场上最常用的技术分析工具。 随机指标KDJ一般是用于股票分析的统计体系,根据统计学原理,通过一个特定的周期(常为9日、9周等)
Order Blocks Breaker
Suvashish Halder
5 (2)
Introducing Order Blocks Breaker , a brand-new way to identify and leverage order blocks in your trading strategy. After developing multiple order block tools with unique concepts, I’m proud to present this tool that takes things to the next level. Unlike previous tools, Order Blocks Breaker not only identifies order blocks but also highlights Breaker Order Blocks —key areas where the price is likely to retest after a breakout. MT5 -  https://www.mql5.com/en/market/product/124102/ This tool inco
UPD1 X00 Levels
Vitaliy Kuznetsov
5 (10)
L'indicateur montre des niveaux ronds sur le graphique. Ils sont également appelés niveaux psychologiques, niveaux de banque ou niveaux des principaux acteurs. À ces niveaux, il y a une véritable lutte entre les haussiers et les baissiers, une accumulation de nombreux ordres, ce qui entraîne une volatilité accrue. L'indicateur s'adapte automatiquement à tout instrument et à toute période. Si le niveau 80 est cassé puis testé, il faut acheter. Si le niveau 20 est cassé puis testé, vendre. L'obje
FREE
Power Trend Free
Yurij Kozhevnikov
5 (2)
Power Trend Free - the indicator shows the trend strength in the selected period. Input Parameters The indicator has three input parameters: Period - a positive number greater than one, it shows the number of candlesticks used for calculations. If you enter one or zero, there will be no error, but the indicator will not be drawn. Applied Price - the standard "Apply to:" set meaning data used for the indicator calculation: Close - Close prices; Open - Open prices; High - High prices; Low - Low p
FREE
Two Period RSI
Libertas LLC
5 (4)
Two Period RSI compares long-term and short-term RSI lines, and plots a fill between them for improved visualization. Fill is colored differently according to an uptrend (short period RSI above long period RSI) or a downtrend (short period RSI below long period RSI). Short-term RSI crossing long-term RSI adds a more robust trend confirmation signal than using single period RSI alone. This is a small tool to help visualize and confirm RSI trends. We hope you enjoy! Looking for RSI alerts? You can
FREE
Les acheteurs de ce produit ont également acheté
Genesis Matrix Pro is a professional multi-timeframe trend detection indicator designed to help traders identify high-quality market alignment with clarity and structure. It combines 12 different technical indicators into one visual alignment matrix, allowing traders to quickly see when market conditions are bullish, bearish, or neutral. A signal is generated only when the selected strategies are aligned, helping reduce noise and improve decision-making. PLEASE CONTACT ME AFTER PURCHASE TO GET
Gann Made Easy
Oleg Rodin
4.83 (163)
Gann Made Easy est un système de trading Forex professionnel et facile à utiliser qui est basé sur les meilleurs principes de trading en utilisant la théorie de mr. WD Gann. L'indicateur fournit des signaux d'ACHAT et de VENTE précis, y compris les niveaux Stop Loss et Take Profit. Vous pouvez échanger même en déplacement en utilisant les notifications PUSH. VEUILLEZ ME CONTACTER APRÈS L'ACHAT POUR RECEVOIR GRATUITEMENT DES INSTRUCTIONS DE TRADING ET D'EXCELLENTS INDICATEURS SUPPLÉMENTAIRES! Vou
The Propfolio Master Suite is the ultimate all-in-one analytical workstation for professional traders. Combining the power of the Beat The Market Maker (BTMM) methodology, Smart Money Concepts (SND/Liquidity), and Advanced Volume Profile, this suite replaces multiple different indicators with one optimized engine. Monitor up to 14 pairs simultaneously from a single chart, instantly identify market cycles, and seamlessly map institutional footprints with the click of a button. The Command Center
Scalper Inside PRO
Alexey Minkov
4.74 (69)
Scalper Inside PRO Scalper Inside PRO is an intraday trend and scalping indicator for MetaTrader 4 that uses an exclusive algorithm to quickly detect market direction and key target levels. It automatically calculates entry, exit and multiple profit targets, and shows detailed performance statistics so you can see how different instruments and strategies performed. This helps you choose the most suitable trading instruments for the current market conditions. Additionally, you can easily integrat
Le système PRO Renko est un système de trading très précis spécialement conçu pour le trading de graphiques RENKO. Il s'agit d'un système universel qui peut être appliqué à divers instruments de négociation. Le système neutralise efficacement ce qu'on appelle le bruit du marché en vous donnant accès à des signaux d'inversion précis. L'indicateur est très facile à utiliser et n'a qu'un seul paramètre responsable de la génération du signal. Vous pouvez facilement adapter l'outil à n'importe que
Auto Optimized Parabolic RSI : Moteur de Momentum 3D Avancé La plupart des indicateurs pour les particuliers échouent car ils s'appuient sur des paramètres statiques qui se brisent dès que la volatilité du marché change. L'Auto Optimized Parabolic RSI résout le problème de l'« obsolescence des indicateurs » en recalculant continuellement son propre avantage mathématique, apportant une adaptation quantitative de niveau institutionnel directement sur votre terminal MT5. L'Avantage Principal : Opti
NAM Order Blocks
NAM TECH GROUP, CORP.
3.67 (3)
MT4 Multi-timeframe Order Blocks detection indicator. Features - Fully customizable on chart control panel, provides complete interaction. - Hide and show control panel wherever you want. - Detect OBs on multiple timeframes. - Select OBs quantity to display. - Different OBs user interface. - Different filters on OBs. - OB proximity alert. - ADR High and Low lines. - Notification service (Screen alerts | Push notifications). Summary Order block is a market behavior that indicates order collection
Tout d'abord, il convient de souligner que cet outil de trading est un indicateur non repeint, non redessiné et non retardé, ce qui le rend idéal pour le trading professionnel. Cours en ligne, manuel utilisateur et démonstration. L'indicateur Smart Price Action Concepts est un outil très puissant à la fois pour les nouveaux et les traders expérimentés. Il regroupe plus de 20 indicateurs utiles en un seul, combinant des idées de trading avancées telles que l'analyse du trader Inner Circle et les
Quants HL Break
Ferhat Mutlu
5 (2)
Calcul avancé effectué par l'action pure des prix pour trouver les cassures LH et HL. Cela vous donnera d'excellents points d'inversion sur le marché.Les signaux LH et HL peuvent également être utilisés pour les évasions de traingle. Une fois que la cassure se produit, cela indique un fort renversement.Beau filtre pour les moyennes mobiles.Je suggère fortement de l'utiliser avec des indicateurs de tendance. Peut être utilisé comme une confirmation supplémentaire pour le support et la résistanc
Dynamic Forex28 Navigator
Bernhard Schweigert
4.43 (7)
Dynamic Forex28 Navigator - L'outil de trading Forex de nouvelle génération. ACTUELLEMENT 49 % DE RÉDUCTION. Dynamic Forex28 Navigator est l'évolution de nos indicateurs populaires de longue date, combinant la puissance de trois en un : Advanced Currency Strength28 Indicator (695 avis) + Advanced Currency IMPULSE avec ALERT (520 avis) + CS28 Combo Signals (Bonus). Détails sur l'indicateur https://www.mql5.com/en/blogs/post/758844 Qu'offre l'indicateur de force de nouvelle génération ? Tout
PZ Harmonacci Patterns
PZ TRADING SLU
3.17 (6)
Trade smarter, not harder: Empower your trading with Harmonacci Patterns This is arguably the most complete harmonic price formation auto-recognition indicator you can find for the MetaTrader Platform. It detects 19 different patterns, takes fibonacci projections as seriously as you do, displays the Potential Reversal Zone (PRZ) and finds suitable stop-loss and take-profit levels. [ Installation Guide | Update Guide | Troubleshooting | FAQ | All Products  ] It detects 19 different harmonic pric
RFI levels PRO
Roman Podpora
5 (1)
L'indicateur montre avec précision les points de retournement et les zones de retour des prix où le       Acteurs majeurs   . Vous repérez les nouvelles tendances et prenez des décisions avec une précision maximale, en gardant le contrôle de chaque transaction. VERSION MT5     -     Révèle son potentiel maximal lorsqu'il est combiné à l'indicateur   TREND LINES PRO Ce que l'indicateur montre : Structures et niveaux d'inversion avec activation au début d'une nouvelle tendance. Affichage des nive
Trend Catcher ind
Ramil Minniakhmetov
INDICATEUR DE DÉTECTEUR DE TENDANCE L'indicateur de détecteur de tendance analyse les mouvements de prix du marché grâce à une combinaison d'indicateurs d'analyse de tendance adaptatifs, propriétaires et personnalisés. Il identifie la véritable direction du marché en filtrant les fluctuations à court terme et en se concentrant sur la force de la dynamique sous-jacente, l'expansion de la volatilité et la structure des prix. Il utilise également une combinaison d'indicateurs personnalisés de lis
Grabber System
Ihor Otkydach
5 (2)
Je vous présente un excellent indicateur technique : Grabber, qui fonctionne comme une stratégie de trading "tout-en-un", prête à l'emploi. En un seul code sont intégrés des outils puissants d'analyse technique du marché, des signaux de trading (flèches), des fonctions d'alerte et des notifications push. Chaque acheteur de cet indicateur reçoit également gratuitement : L'utilitaire Grabber : pour la gestion automatique des ordres ouverts Un guide vidéo étape par étape : pour apprendre à installe
Advanced Supply Demand
Bernhard Schweigert
4.91 (300)
Offre spéciale : 40 % de réduction La solution idéale pour les traders débutants comme experts ! Cet indicateur est un outil de trading unique, performant et abordable grâce à l’intégration de nombreuses fonctionnalités exclusives et d’une nouvelle formule. Cette mise à jour vous permet d’afficher des zones sur deux unités de temps. Vous pourrez ainsi visualiser non seulement une unité de temps supérieure, mais aussi l’unité de temps du graphique, ainsi que l’unité de temps supérieure : des z
Signal GoldRush Trend Arrow L'indicateur GoldRush Trend Arrow Signal fournit une analyse précise et en temps réel des tendances, spécialement conçue pour les scalpers à haute vitesse et à court terme sur la paire XAU/USD. Conçu spécialement pour les intervalles de temps d'une minute, cet outil affiche des flèches directionnelles indiquant clairement les points d'entrée, ce qui permet aux scalpers de naviguer en toute confiance dans des conditions de marché volatiles. L'indicateur se compose
Introduction to Fractal Pattern Scanner Fractal Indicator refers to the technical indicator that makes use of the fractal geometry found in the financial market. Fractal Pattern Scanner is the advanced Fractal Indicator that brings the latest trading technology after the extensive research and development work in the fractal geometry in the financial market. The most important feature in Fractal Pattern Scanner is the ability to measure the turning point probability as well as the trend probabi
ACTUELLEMENT 40% DE RÉDUCTION La meilleure solution pour tout débutant ou trader expert ! Cet indicateur est un outil de trading unique, de haute qualité et abordable car nous avons incorporé un certain nombre de caractéristiques exclusives et une nouvelle formule. Avec seulement UN graphique, vous pouvez lire la force de la devise pour 28 paires Forex ! Imaginez comment votre trading va s'améliorer parce que vous êtes capable de repérer le point de déclenchement exact d'une nouvelle tendance
Cycle Sniper
Elmira Memish
4.39 (36)
Please contact us after your purchase and we will send you the complimentary indicators to complete the system Cycle Sniper is not a holy grail but when you use it in a system which is explained in the videos, you will feel the difference. If you are not willing to focus on the charts designed with Cycle Sniper and other free tools we provide, we recommend not buying this indicator. We recommend watching the videos about the indiactor and system before purchasing. Videos, settings  and descri
Market Structure Patterns MT4
Samuel Manoel De Souza
5 (18)
Market Structure Patterns   est un indicateur basé sur les   Smart Money Concepts   qui affiche les   éléments SMC/ICT   pouvant améliorer vos décisions de trading. Profitez des   alertes ,   notifications push   et   emails   pour être informé lorsqu’un élément se forme sur le graphique, que le prix franchit un niveau et/ou entre dans une zone. Les développeurs peuvent accéder aux valeurs des éléments de l’indicateur via les   variables globales , permettant l’automatisation des décisions de tr
Advanced UT BOT ALERTS for MT4 Système professionnel de détection de tendance multi-filtres | Version améliorée du moteur UT BOT Nous proposons uniquement des indicateurs de haute qualité. Advanced UT BOT est conçu pour un usage professionnel, avec une logique de signal stable et un calcul sécurisé qui évite tout retard ou mise à jour erronée. Il ne redessine, ne supprime ni ne modifie aucun signal passé. Tous les signaux BUY et SELL sont générés uniquement après la clôture de la bougie , garant
Contactez-moi après l'achat pour obtenir un EA en bonus basé sur cet indicateur. La Self Optimizing Double MA Strategy est un outil de trading de niveau professionnel conçu pour éliminer les approximations de paramètres. Propulsé par un moteur d'auto-optimisation intégré, il s'adapte continuellement aux conditions changeantes du marché en simulant des milliers de combinaisons de paramètres en arrière-plan afin de maintenir un avantage statistique. Au lieu de s'appuyer sur des paramètres statiqu
Candle Power Pro
Thushara Dissanayake
4.5 (8)
Le       Candle Power Pro       est un outil de trading sophistiqué conçu pour décoder       pression réelle sur le volume, déséquilibres des données de ticks et dynamique du flux d'ordres institutionnels       en mesurant le       bataille entre les tics haussiers et les tics baissiers       en temps réel. Cet indicateur transforme les données brutes       données de volume en informations exploitables   , aidant les traders à identifier       Mouvements d'argent intelligent, chasses aux liqui
Si vous tradez sur le marché du Forex, disposer d'informations détaillées sur la force des devises et la corrélation entre les paires de devises peut élever votre trading à un niveau supérieur. La corrélation vous aidera à réduire votre risque de moitié, tandis que l'analyse de la force maximisera vos profits. Cet indicateur propose une approche hybride pour sélectionner les paires de devises les plus appropriées en combinant l'analyse de la force des devises et la corrélation des paires. Comme
Route Lines Prices - est un indicateur conçu pour identifier les directions des prix. Son interface simple intègre plusieurs algorithmes de calcul du comportement des prix et de leur direction future. Ces algorithmes incluent le calcul de la volatilité et le lissage des prix en fonction des unités de temps utilisées. L'indicateur possède un unique paramètre permettant de modifier la valeur « Calculating price values ». La valeur par défaut de 1 assure un calcul automatique équilibré, utilisabl
KURAMA GOLD SIGNAL PRO (MT4) — Système de Trading XAUUSD Complet avec Filtre à 7 Couches, TP/SL Automatique et Notation de Qualité PAS DE REPAINT. PAS DE REDESSIN. PAS DE RETARD. Chaque signal est permanent. Ce que vous voyez est ce que vous obtenez. BONUS : Achetez la licence à vie et recevez AI Zone Radar (valeur $59) + manuel PDF complet GRATUIT. Envoyez-moi un message après l'achat. AI Zone Radar : https://www.mql5.com/en/market/product/175834 CONFIANCE DES TRADERS : Déjà utilisé par une
Master head and shoulders patterns for better trading decisions A head and shoulders pattern is a chart formation that resembles a baseline with three peaks, the outside two are close in height and the middle is highest. It predicts a bullish-to-bearish trend reversal and is believed to be one of the most reliable trend reversal patterns. It is one of several top patterns that signal, with varying degrees of accuracy, that a trend is nearing its end. [ Installation Guide | Update Guide | Trouble
PZ Double Top Bottom
PZ TRADING SLU
5 (1)
Trade double tops and bottoms effectively The PZ Double Top/Bottom Indicator is a technical analysis tool that helps traders identify potential price reversal patterns in the market. These patterns, known as double tops and bottoms, are characterized by two consecutive peaks or valleys in the price of an asset. Double tops and bottoms are often seen as potential reversal patterns because they can signal a change in the direction of the current trend. [ Installation Guide | Update Guide | Troubl
Un indicateur technique qui structure les graphiques et identifie les mouvements de prix cycliques. Peut fonctionner sur n'importe quel graphique. Plusieurs types de notifications. Il y a des flèches supplémentaires sur le graphique lui-même. Sans revenir sur l'histoire, fonctionne sur la fermeture de la bougie. TF recommandé à partir de M5 et plus. Facile à utiliser et à configurer les paramètres. Lorsque vous utilisez 2 indicateurs avec des paramètres différents, vous pouvez les utiliser sans
Market Makers
Mohamed Hassan
5 (4)
After purchase, contact me privately to receive 1 month of free testing with EA Forex Proton! This advanced MT4 trading robot automatically executes signals from any MT4 indicator, including Market Makers. The latest version also includes AI integration, allowing each trade signal to be analyzed using Artificial Intelligence. Live Signal with EA Forex Proton: Click here Market Makers is a powerful price action trading system designed to identify high-probability Buy and Sell opportunities based
Plus de l'auteur
The indicator is based on MA with additional processing of all the current prices, as well as all Highs and Lows for an appropriate period. The product efficiently displays trend changes and tracks a trend line and color if conditions remain unchanged. The indicator has only three parameters making it easy to configure. Parameters PeriodTrend  - amount of bars used for a trend calculation PeriodAverage - indicator line averaging period Method - averaging method
The indicator shows the exact price position in the current market on any symbol. It shows the trend direction on the current chart as well as on the two subsequent higher timeframes at the same time (from top to bottom). For example, you can observe the trend direction on M5 and M15 without leaving the M1 chart. The indicator switches all trend depending on the market conditions preventing you from entering against a trend or allowing you to exit a position in a timely manner. The indicator is
This indicator shows the current market situation relative to the price volatility channel, its external and internal boundaries, displays the last direction of the price movement. The main purpose of the indicator is to identify the trend movement and its boundaries. With a wide channel, it can be used for determining the initial price movement waves. It works on any instrument and any time frame of the chart. It works in 2 different modes: The first mode shows any changes in the channel when t
The oscillator shows reversal points and the movement strength very well. It can be used on any symbol and any timeframe. It has a parameter of the level when the signal reaches the required power. The indicator is very easy to setup. Indicator bars are not redrawn. Description of the Parameters PeriodPower - signal power calculation period LevelPower - the required level of the signal power
Индикатор очень своевременно показывает изменение направления рынка на любом инструменте.   Более того, этот индикатор мультитаймфреймовый, что позволяет увидеть на текущем периоде графика смену направления движения рынка с более старшего таймфрейма. Стрелка вверх сигнализирует о восходящем движении, стрелка вниз - о нисходящем. Каждая стрелка имеет свою ценовую составляющую, равную(как правило) значению экстремума на используемом таймфрейме, что можно использовать в качестве установки стоповых
Индикатор очень своевременно показывает входы в рынок на любом инструменте.  Каждая стрелка имеет свою ценовую составляющую, равную(как правило) значению экстремума на используемом таймфрейме, что можно использовать в качестве установки стоповых ордеров или других действий при применении индикатора в советниках. Индикатор имеет минимальное количество параметров, позволяющих без особого труда настроить его работу. Параметр Level_Open  отвечает за скорость выдачи сигнала. Чем больше этот параметр
Новая серия индикаторов Veles Dynamic.   Индикаторы не перерисовывают своих значений. Эти индикаторы работают быстрее и точнее аналогичных по названию. Индикатор Veles_dMA_Plus представляет собой динамическую МА, рассчитанную по текущим ценам инструмента. Имеется возможность динамического сглаживания линии. Есть возможность отображения текущего трендового канала с изменением его волатильности. Параметры: period - период динамической МА price - применяемая цена shift - сдвиг МА влево от текущи
Новая серия индикаторов Veles Dynamic.     Индикаторы не перерисовывают своих значений. Эти индикаторы работают быстрее и точнее аналогичных по названию. Индикатор Veles_dMACD представляет собой разницу показаний между двух динамических МА, рассчитанных по текущим ценам инструмента. Хорошо показывает разворотные моменты, позволяет точно определять дивергенции. Имеет цветовое сопровождение изменения показаний. Параметры: period_Fast - период быстрой динамической МА period_Slow  - период медлен
Новая серия индикаторов Veles Dynamic.     Индикаторы не перерисовывают своих значений. Эти индикаторы работают быстрее и точнее аналогичных по названию. Индикатор Veles_dChannel представляет собой динамическую МА с расчетным каналом по текущим ценам инструмента. Индикатор показывает полностью законченное движение в цикле. Данный индикатор может использоваться в качестве установки и траллирования стопов при скальпинге.  Параметры: period - период динамической МА price - применяемая цена shif
Новая серия индикаторов Veles Dynamic.     Индикаторы не перерисовывают своих значений. Эти индикаторы работают быстрее и точнее аналогичных по названию. Индикатор Veles_dTrend представляет собой гистограмму, рассчитанную на основе нескольких динамических алгоритмов, использующих текущие цены инструмента. Пока индикатор не покажет смену тренда, будьте уверены, что тренд продолжит свое направление. Кроме этого, есть зоны принятия решения, которые ограниченны уровнями.В этих зонах будет самый
Этот индикатор - очередная разновидность ЗигЗага, за исключением, он не рисует текущую линию, которая может перерисоваться. Этот индикатор, если нарисовал конечную точку, по закрытому бару, то больше ее не изменяет - это означает смену направления и следующая точка будет другого цвета. Может быть применен как для определения основного движения, при использовании увеличенных параметров, так и непосредственно для входа с минимальным риском.Очень хорошо показывает все волны. Работает с любым инстру
Индикатор iVeles_Channel_Extremum_II_MTF вычисляет точки слома направлений движения цены на установленном в параметрах ТФ, на основе этих точек и выбранного их количества строится основной канал цены, который можно использовать в качестве уровней поддержки и сопротивления для меньшего ТФ, на котором установлен индикатор. В зависимости от направления движения основного тренда рассчитывается средняя линия канала по уровню Фибоначи, от которой, как правило, идет отскок в сторону тренда. Также по ур
Индикатор iVeles_MACD_Pro представляет симбиоз обычного индикатора MACD или  разницу показаний между двух динамических МА, рассчитанных по текущим ценам инструмента. Сигнальная линия отсутствует, но ее заменяет более точные динамические облачные уровни. Хорошо показывает разворотные моменты, позволяет точно определять дивергенции. Имеет цветовое сопровождение изменения показаний. Параметры: period_Fast - период быстрой МА period_Slow    - период медленной МА price_Bar - применяемая цена level -
Veles RSI
Gennady Mazur
Индикатор iVeles_RSI представляет собой  обычный  RSI, привязанный к нулевой отметке . В отличии от обычного RSI, наложены уровни сигнала в виде облака, что заметно расширяет области применения данного индикатора. Очень хорошо показывает разворотные моменты, так же позволяет точно определять дивергенции. Параметры: period - период RSI price - применяемая цена level - уровень облака
Veles RVI
Gennady Mazur
Индикатор iVeles_RVI представляет собой  обычный  RVI, с пересчитанными и приведенными значениями . В отличии от обычного RVI, наложены уровни сигнала в виде облака, что заметно расширяет области применения данного индикатора. Очень хорошо показывает разворотные моменты и циклы тенденций, так же позволяет определять дивергенции. Параметры: period - период RVI price - применяемая цена level - уровень облака
Индикатор iVeles_DeMarker представляет собой  обычный  DeMarker, с пересчитанными и приведенными к нулю значениями . В отличии от обычного DeMarker, наложены уровни сигнала в виде облака, что заметно расширяет области применения данного индикатора. Очень хорошо показывает разворотные моменты и циклы тенденций, так же позволяет определять дивергенции. Параметры: period - период DeMarker level - уровень облака
Veles CCI
Gennady Mazur
Индикатор iVeles_CCI представляет собой  обычный  CCI . В отличии от обычного CCI, наложены уровни сигнала в виде облака, что заметно расширяет области применения данного индикатора. Очень хорошо показывает окончание трендов, разворотные моменты и циклы тенденций, так же позволяет определять дивергенции. Параметры: period - период CCI price - применяемая цена level - уровень облака
Индикатор iVeles_Moment представляет собой  обычный  Momentum, с пересчитанными и приведенными к нулю значениями . В отличии от обычного Momentum, наложены уровни сигнала в виде облака, что заметно расширяет области применения данного индикатора. Очень хорошо показывает разворотные моменты и циклы тенденций, может применяться как основной сигнал для входа в позицию. Параметры: period - период Momentum price - применяемая цена level - уровень облака
Индикатор iVeles_Trend_X_II - использует специализированный расчет текущих цен графика. Очень качественно и своевременно показывает смену направления, более того, отображаемая цена индикатора может быть использован в качестве уровня принятия решения. Работает качественно на любом ТФ и с любым инструментом. Параметры: period - период расчетов average   - усреднение  МА method - применяемый метод shift - сдвиг показаний
Индикатор iVeles_Perfect_Oscilator является опережающим и одним из самых лучших осциляторов на сегодняшний день,  использует специализированный расчет текущих цен графика.  Очень качественно и своевременно показывает смену направления, очень точный подход к уровням перекупленности и перепроданности, что позволяет своевременно принять решение по сделке.  Работает качественно на любом ТФ и с любым инструментом. Параметры: period_Osc - период расчетов average_Osc  - усреднение  МА method_Osc - прим
Индикатор iVeles_Perfect_Oscilator является опережающим и одним из самых лучших осциляторов на сегодняшний день,  использует специализированный расчет текущих цен графика.  Очень качественно и своевременно показывает смену направления, очень точный подход к уровням перекупленности и перепроданности, что позволяет своевременно принять решение по сделке.  Работает качественно на любом ТФ и с любым инструментом. Параметры: Period - период расчетов Average  - усреднение  МА Method - применяемый мето
Представлен принципиально новый индикатор ZigZag, который отличается от стандартного абсолютной легкостью, быстродействием расчетов и очень высокой точностью. В основе индикатора заложен принцип цикличности рынка с совокупностью анализа количества текущих баров и их основных ценовых уровней. Чем меньше баров для определения расчетов, тем более агрессивная постройка линий индикатора. Как и в  стандартном индикаторе перерисовывается только последняя линия, при изменении достигнутого экстремума. П
Данная утилита позволяет осуществлять полноценную торговлю в ручном режиме в тестере. Это особенно необходимо для тестирования своих стратегий торговли, без открытия счета и совершенно без риска. Кроме этого утилитой можно пользоваться и при обычной торговле на счете. Открытие любого количества позиций (при условии достаточности маржи) в любом направлении. Закрытие всех позиций по направлению или вообще всех открытых позиций счета с данным магическим числом. Параметры: Volume - объем сделки Mag
Советник-утилита "Veles Custom Chart" создает выбранный один из 3-ех персональный график движения цены в режиме реального времени. Возможно создание временного графика с длительностью свечи не минуты, а равного заданному числу секунд, тикового графика, где размер и длительность бара определяется количеством тиков в баре или тикового объема, и ренко графика по размеру кирпичика бара, при чем этот график полностью повторяет структуру движения цены, отрисовывая противоположные тени цены. Графики о
Filtrer:
Aucun avis
Répondre à l'avis