KT Candlestick Patterns MT4
- Indicateurs
-
KEENBASE SOFTWARE SOLUTIONS
 Keenbase Trading développe des indicateurs professionnels et des Expert Advisors pour MetaTrader 4 et MetaTrader 5 afin d'aider les traders à prendre des décisions de trading plus éclairées.
 - Version: 1.1
- Activations: 5
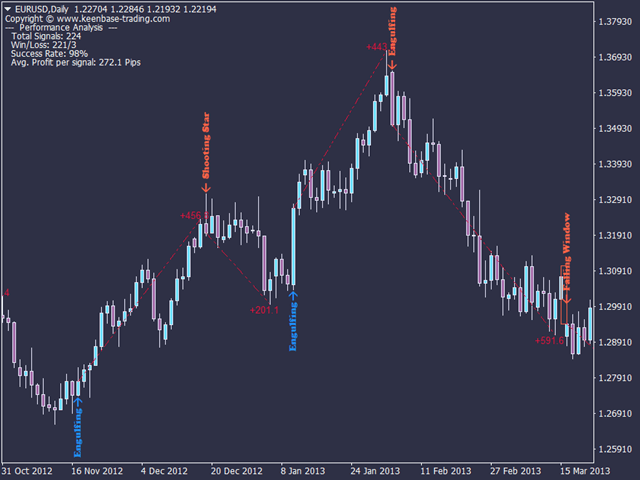
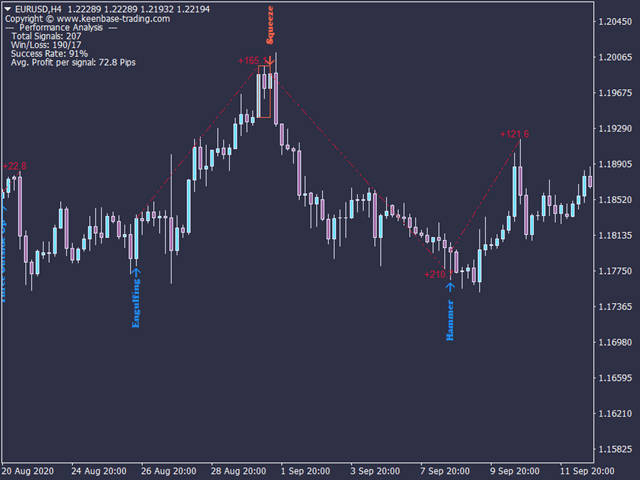
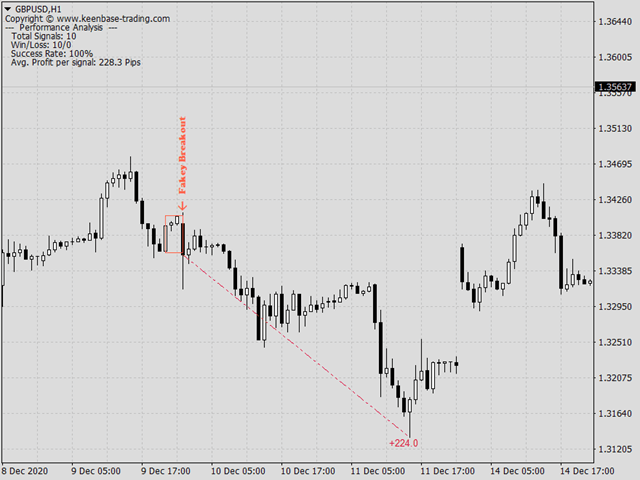
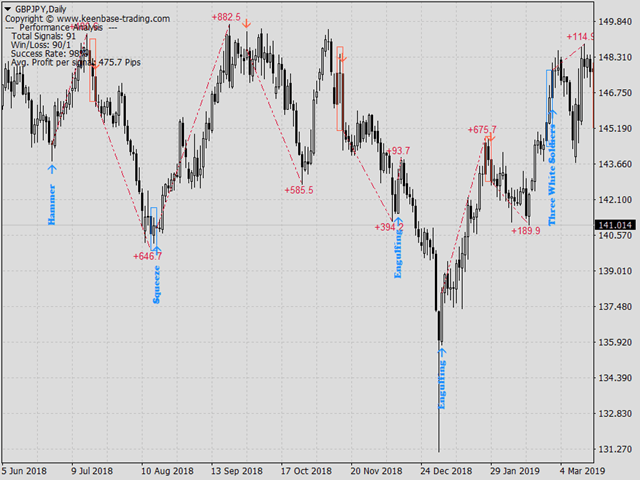
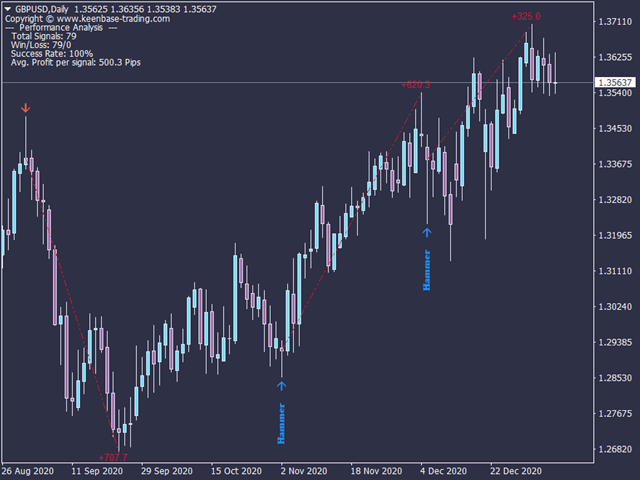
KT Candlestick Patterns identifie et marque en temps réel les 24 figures de chandeliers japonais les plus fiables. Depuis le 18e siècle, les traders japonais utilisent ces figures pour prévoir la direction des prix.
Il est vrai que tous les modèles ne se valent pas, mais lorsqu’ils sont combinés à des méthodes comme les supports et résistances, ils offrent une lecture plus précise du marché.
Cet indicateur inclut de nombreux motifs étudiés en détail dans le livre de Steve Nison : "Japanese Candlestick Charting Techniques".
Il détecte également des figures complexes rarement connues des traders traditionnels.
Fonctionnalités
- Définissez un objectif de pips comme "référence de succès" pour obtenir immédiatement le taux de réussite de chaque signal.
- Détecte 24 figures japonaises célèbres avec une grande précision.
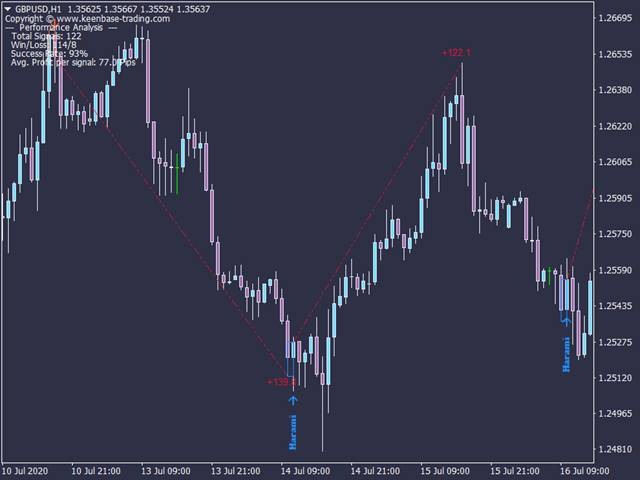
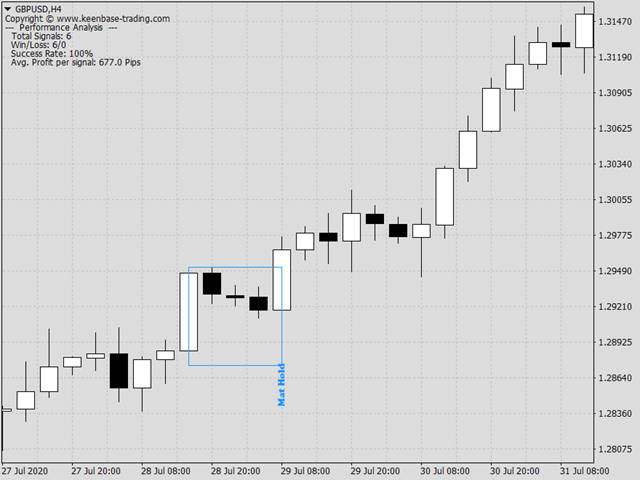
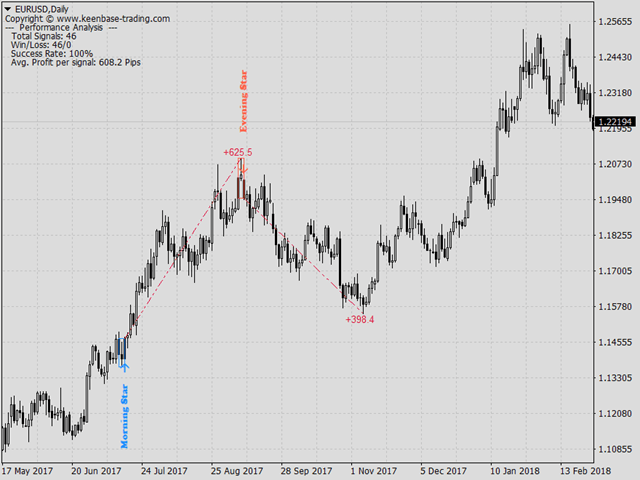
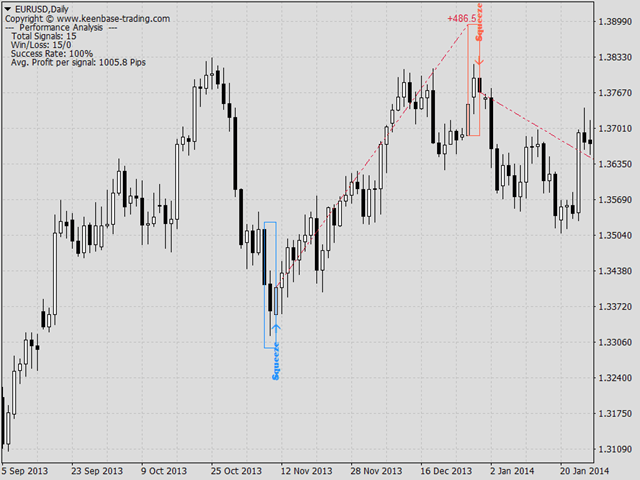
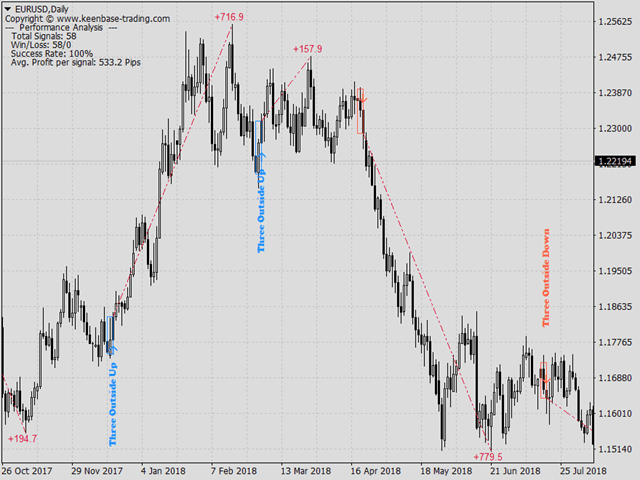
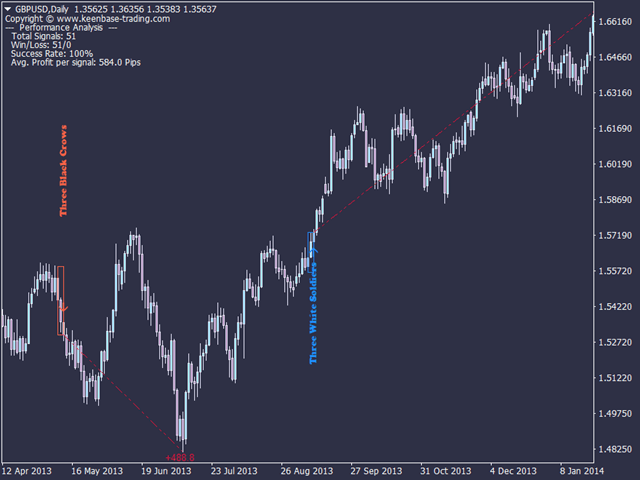
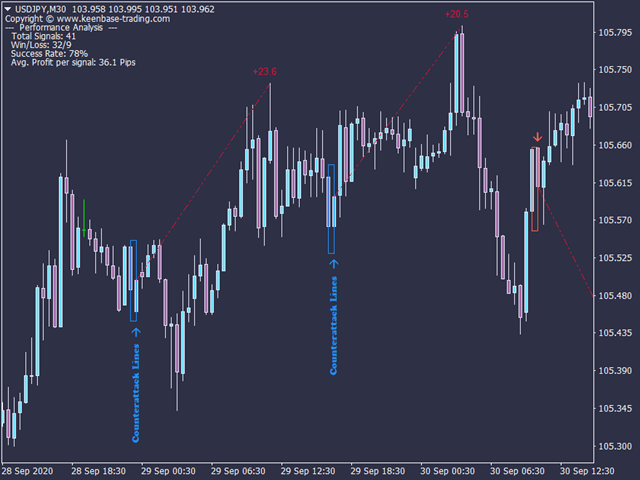
- Analyse les performances en temps réel et affiche les statistiques de précision.
- Permet de définir un nombre minimum de chandeliers entre chaque motif pour éviter la surcharge visuelle.
- Combine la direction de la tendance pour une détection plus fiable.
- Inclut des figures de retournement, de continuation et des motifs neutres (Doji).
- Prend en charge toutes les alertes MetaTrader.
Figures incluses
----- Figures de retournement -----
- Harami
- Marteau / Étoile filante
- Englobante
- Trois soldats blancs / Trois corbeaux noirs
- Trois dehors haut / bas
- Trois dedans haut / bas
- Étoile du matin / du soir
- Compression
- Ceinture
- Nuage noir / Ligne pénétrante
- Bloc d'avance / de descente
- Lignes d’attaque
- Fond / sommet en échelle
- Kicker
- Pigeon / Faucon descendant
----- Figures de continuation -----
- Marubozu
- Fenêtre haussière / baissière
- Fausse cassure
- Maintien Mat
- Trois méthodes ascendantes / descendantes
----- Figures neutres -----
- Doji simple
- Doji longues jambes
- Doji pierre tombale
- Doji libellule
Optimiser la précision des signaux
- Activez tous les motifs à analyser.
- Définissez votre nombre de pips cible comme référence de succès.
- Désactivez chaque motif un à un pour vérifier l’impact sur le taux de réussite.
- Gardez désactivé un motif qui améliore les résultats.
- Rétablissez un motif si la précision diminue sans lui.
- Ajustez "Min. bougies entre motifs" entre 10 et 50 pour équilibrer qualité et fréquence.
Paramètres d’entrée
- Bougies historiques : Nombre de bougies à utiliser. Diminuez en cas de ralentissement.
- Min. bougies entre motifs : Espace minimal entre deux figures.
- Afficher les noms : Affiche les noms des figures sur le graphique.
- Sélection des motifs : Active/désactive des motifs selon votre actif et timeframe.
- Analyse de performance : Affiche les statistiques des signaux détectés.
- Pips de référence : Seuil utilisé pour évaluer la réussite.
- Afficher le texte : Active ou désactive l’analyse affichée en haut à gauche du graphique.