Overlay Renko MT4

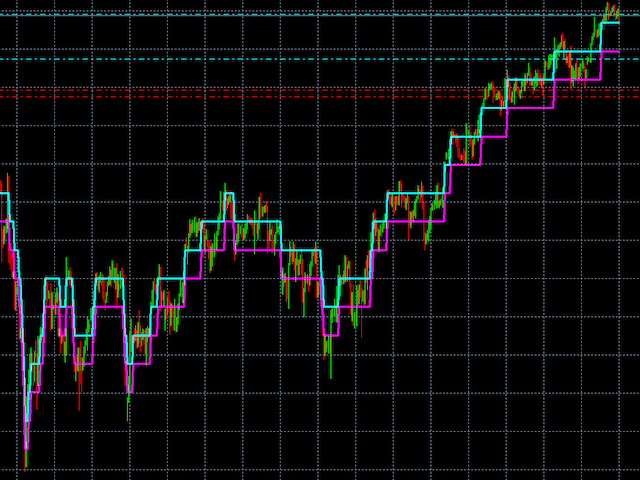
Overlay Renko is an indicator which plots Renko bricks overtop of the chart. You can select the brick size as well as whether or not to use the close price or the high/low price of the candles. Typically Renko bricks are based on price alone, not time, however unlike normal Renko bricks the only difference is this indicator allows you to see the price action going on within each Brick by overlaying the bricks on top of the standard chart. Renko bricks are extremely useful for trend trading and many different strategies can be formed from them. Buffers are provided allowing you to make an EA out of the indicator.
Produits recommandés
Introduction It is common practice for professional trades to hide their stop loss / take profit from their brokers. Either from keeping their strategy to the themselves or from the fear that their broker works against them. Using this indicator, the stop loss / take profit points will be drawn on the product chart using the bid price. So, you can see exactly when the price is hit and close it manually.  Usage Once attached to the chart, the indicator scans the open orders to attach lines for t
Super Reversal Pattern
Parfait Mujinga Ndalika
Super Reversal Pattern Indicator Unlock the power of advanced pattern recognition with our Super Reversal Pattern Indicator. Designed for traders seeking precision and reliability, this indicator identifies one of the most effective reversal patterns in technical analysis, offering a significant edge in your trading strategy. Key Features: Non-Repainting Accuracy: Enjoy the confidence of non-repainting technology. Once a Super Reversal Pattern is detected, it remains static, providing consiste
Octave Fractal Channel — Dynamic Gann-Based Support/Resistance Levels with Auto-Scaling. This indicator plots a dynamic channel based on the fractal structure of price movement. Channel levels adapt to the current symbol and timeframe, making it suitable for use across various financial instruments — from currency pairs to cryptocurrencies and indices. The indicator can be used in combination with other technical tools, such as the RSI oscillator, to provide additional signal filtering. How to
Power Renko is an indicator which plots Renko bricks underneath the chart using a histogram. You can select the brick size and the timeframe of the Renko bricks as well as whether or not to use the close price or the high/low price of the candles. Renko bricks are based on price alone, not time, therefor the Renko bricks will not be aligned with the chart's time. They are extremely useful for trend trading and many different strategies can be formed from them. Buffers are provided allowing you t
Alpha Trend sign est notre outil de Trading très populaire depuis longtemps, il valide notre système de Trading et invite clairement les signaux de Trading sans dérive. Fonctions principales: • En fonction de la zone active du marché, selon les indicateurs, il est intuitif de déterminer si le cours actuel appartient à la tendance ou à la tendance. Et coupez le marché selon les flèches d'indication de l'indicateur, les flèches vertes suggèrent d'acheter et les flèches rouges suggèrent de vend
"Auto FIBO Pro" Crypto_Forex indicator - est un excellent outil auxiliaire dans le trading ! - L'indicateur calcule et place automatiquement sur le graphique les niveaux de Fibo et les lignes de tendance locales (couleur rouge). - Les niveaux de Fibonacci indiquent les zones clés où le prix peut s'inverser. - Les niveaux les plus importants sont 23,6 %, 38,2 %, 50 % et 61,8 %. - Vous pouvez l'utiliser pour le scalping inversé ou pour le trading en grille de zones. - Il existe également de nombr
Infinity Trend Pro
Yaroslav Varankin
1 (1)
This is a trend indicator without redrawing Developed instead of the binary options strategy (by the color of the Martingale candlestick) Also works well in forex trading When to open trades (binary options) A signal will appear in the place with a candle signaling the current candle It is recommended to open a deal for one candle of the current timeframe M1 and M5 When a blue dot appears, open a deal up When a red dot appears, open a trade down. How to open trades on Forex. When a signal is rec
Price Magnet — Price Density and Attraction Levels Indicator Price Magnet is a professional analytical tool designed to identify key support and resistance levels based on statistical Price Density. The indicator analyzes a specified historical period and detects price levels where the market spent the most time. These zones act as “magnets,” attracting price action or forming a structural base for potential reversals. Unlike traditional Volume Profile tools, Price Magnet focuses on price-time d
Magic Filter MTF is perfect for any strategy. you do not need to load the chart with extra indicators like this one indicator will replace all additional filters for you it can also be a great strategy. it combines well with trading at local minima and maximums (resistance levels) multi-timeframe-multi-currency indicator 4 screen system is used 4 rows of arrows UTB indicators adjusted for different periods when two arrows pointing in the same direction on the same timeframe coincide,I t c
Wave Wolf MT4
Andrei Salanevich
L'indicateur Forex Wave Wold MT4 est conçu pour rechercher les vagues de Woolf et les afficher dans la fenêtre actuelle du terminal de trading. Un excellent indicateur pour les traders utilisant les vagues de Wolf dans le commerce. Son application dans les stratégies de trading augmentera considérablement leur efficacité et leur rentabilité. INFORMATIONS SUR L'INDICATEUR Contrairement à d'autres indicateurs de vague Wold, l'indicateur Forex Wave Wold MT4 a un certain nombre de caractéristiques
Happy Scalping Indicator
Leandro Bernardez Camero
Ce indicateur a été conçu pour un scalping agressif et des entrées rapides dans les options binaires , générant des signaux sur chaque bougie afin que vous puissiez savoir exactement ce qui se passe à tout moment. Rejoignez le canal Happy Scalping : MQL5 Ne repince pas : le signal de la bougie actuelle est généré en temps réel , ce qui signifie qu'il peut changer pendant que la bougie est encore en formation, selon que le prix monte ou descend par rapport à la clôture de la bougie précédente.
An indicator of pattern #31 ("Long Island") from Encyclopedia of Chart Patterns by Thomas N. Bulkowski. The second gap is in the opposite direction. Parameters: Alerts - show alert when an arrow appears   Push - send a push notification when an arrow appears (requires configuration in the terminal) GapSize - minimum gap size in points ArrowType - a symbol from 1 to 17 ArrowVShift - vertical shift of arrows in points   ShowLevels - show levels ColUp - color of an upward line ColDn - color of a
This is a new strategy for SUPPLY DEMAND areas It is based on a calculation using the tick volume to detect the big price action in market for both bear /bull actions this smart volume action candles are used to determine the supply and demand areas prices in between main supply and demand lines indicate sideway market  up arrows will be shown when prices moves above the main supply and the secondary supply lines Down arrows will be shown when prices moves below the main demand and the secondary
Daily Candle Predictor est un indicateur qui prédit le cours de clôture d'une bougie. L'indicateur est principalement destiné à être utilisé sur les graphiques D1. Cet indicateur convient à la fois au trading forex traditionnel et au trading d'options binaires. L'indicateur peut être utilisé comme un système de trading autonome, ou il peut servir de complément à votre système de trading existant. Cet indicateur analyse la bougie actuelle, calcule certains facteurs de force à l'intérieur du corps
French Explication des avantages (sans mentionner le code) 1. Différenciation détaillée du marché (3 Dimensions) Isole spécifiquement le mouvement "Latéral" (Sideways) . Pression d'achat (Haussier). Pression de vente (Baissier). Important : Identifie quand le marché est sans direction. 2. Mesure de force via Oscillateur (0-100) Zones Extrêmes : Indique le Surachat/Survente. Remplissage de zone : Colore les zones critiques pour une lecture rapide. 3. Flexibilité du filtrage (Lissage) Réduction du
Description The Market Profile & Volume Profile Indicator is a powerful technical analysis tool designed to visualize market activity and price distribution over specific timeframes. Unlike standard technical indicators that focus solely on price over time, this indicator organizes price data to show where the market spent the most time (TPO) and where the most volume was traded (Volume Profile). It automatically calculates and displays key structural levels such as the Point of Control (POC) ,
Trend Ray
Andriy Sydoruk
The indicator shows the potential trend direction by cyclical-wave dependence. Thus, all the rays of the intersection will be optimal rays, in the direction of which the price is expected to move, taking into account the indicator period. Rays can be used as a direction for potential market movement. But we must not forget that the approach must be comprehensive, the indicator signals require additional information to enter the market.
PZ Support Resistance
PZ TRADING SLU
3.33 (3)
Unlock key market insights with automated support and resistance lines Tired of plotting support and resistance lines? This is a multi-timeframe indicator that detects and plots supports and resistance lines in the chart with the same precision as a human eye would. As price levels are tested over time and its importance increases, the lines become thicker and darker, making price leves easy to glance and evaluate. [ Installation Guide | Update Guide | Troubleshooting | FAQ | All Products ] Boos
The   Trendlines Oscillator   helps traders identify trends and momentum based on the normalized distances between the current price and the most recently detected bullish and bearish trend lines. The indicator features bullish and bearish momentum, a signal line with crossings, and multiple smoothing options. USAGE The   Trendlines Oscillator   works by systematically: Identifying pivot highs and lows. Connecting pivots to form bullish (support) and bearish (resistance) trendlines. Measuring
Pivot Point RSouza
Rosenildo Araujo De Souza
The indicator automatically calculates the levels of pivot points and draws the lines on the chart. The lines that are drawn: Pivot line, R1 line, R2 line, R3 line, S1 line, S2 line, S3 line. Below each line, the value for your level is displayed. The point of pivot is calculated using the traditional method. The colors of the lines and font are configurable, as is a font size of the text. The indicator can only be used in periods equal to or less than D1. Parameters Font color - text color. Fo
Heiken Ashi Smoothed Strategy is a very simple but powerful system to get forex market trend direction. This indicator is actually 2 indicators in 1 pack, Heiken Ashi and Heiken Ashi Smoothed Moving Average both included. Because HA (Heiken Ashi) and HAS (Heiken Ashi Smoothed) are calculated in the same one system event with necessary buffers and loop only, so it is the FAST, OPTIMIZED and EFFICIENT HA having the combined indicator of MetaTrader 4. You can choose to display HA and HAS in the sam
Noize Absorption Index MT4
Ekaterina Saltykova
5 (1)
Noize Absorption Index - is the manual trading system that measures the difference of pressure between bears forces and bulls forces. Green line - is a noize free index that showing curent situation. Zero value of index shows totally choppy/flat market.Values above zero level shows how powerfull bullish wave is and values below zero measures bearish forces.Up arrow appears on bearish market when it's ready to reverse, dn arrow appears on weak bullish market, as a result of reverse expectation. S
Trend Bilio - an arrow indicator without redrawing shows potential market entry points in the form of arrows of the corresponding color: upward red arrows suggest opening a buy, green down arrows - selling. The entrance is supposed to be at the next bar after the pointer. The arrow indicator Trend Bilio visually "unloads" the price chart and saves time for analysis: no signal - no deal, if an opposite signal appears, then the current deal should be closed. It is Trend Bilio that is considered
Based on MACD indicator waves with standard parameters Applies Fibonacci levels to the last two MACD waves, positive and negative respectively, if at the moment the MACD indicator runs out of negative Wave - the color is green, if at the moment the MACD indicator runs out of positive Wave - the color is red. The Wave termination criterion is two ticks with a different MACD sign. Applies trend lines on the last four MACD Waves. Works well with the expert Figures MACD   https://www.mql5.com/ru/mar
Introduction Take your forex trading to the next level with our vibrant, color-coded session indicator! Designed for MT4/MT5, this tool visually separates the Asian (Purple) , London (Yellow) , and NYC (Pink) trading sessions for optimal trading strategy. Key Features Color-Coded Precision : Asian (Purple), London (Yellow), NYC (Pink) sessions marked directly on your chart. Perfect for Session Traders : Focus on the overlaps and high-volatility periods. Compatibility : Works seamlessly with MT4
TMA AI Bands
Monique Ellen Miranda Dos Santos
L'indicateur TMA AI Bands est basé sur la Moyenne Mobile Triangulaire (TMA) avec des bandes supérieure et inférieure dynamiques et des flèches claires d'achat/vente tracées directement sur le graphique. Il intègre une IA pour une optimisation adaptative et garantit l'absence de repainting, fournissant des signaux de renversement précis lorsque le prix touche les bandes. * Paires : fonctionne avec toutes les paires de devises * Échelles de temps recommandées : D1 / W1 / MN * Variables externe
L'indicateur SMC Venom Model BPR est un outil professionnel pour les traders travaillant dans le concept Smart Money (SMC). Il identifie automatiquement deux modèles clés sur le graphique des prix: FVG   (Fair Value Gap) est une combinaison de trois bougies, dans laquelle il y a un écart entre la première et la troisième bougie. Forme une zone entre les niveaux où il n'y a pas de support de volume, ce qui conduit souvent à une correction des prix. BPR   (Balanced Price Range) est une combinaiso
Binary Gap
Teresinha Moraes Correia
A gap is a space on the chart between two consecutive candlesticks where no trading occurred between the close of one candle and the open of the next. In the Forex market, gaps mainly appear at the weekly open, reflecting events or expectations from the weekend. Technically, a gap may indicate an imbalance between supply and demand. Strategies use gaps as signals of possible trend continuation or reversal, offering opportunities for technical analysis based on liquidity and momentum.
The Super Arrow Indicator provides non-repainting buy and sell signals with exceptional accuracy. Key Features No repainting – confirmed signals remain fixed Clear visual arrows: green for buy, red for sell Real-time alerts via pop-up, sound, and optional email Clean chart view with no unnecessary clutter Works on all markets: Forex, gold, oil, indices, crypto Adjustable Parameters TimeFrame Default: "current time frame" Function: Sets the time frame for indicator calculation Options: Can be set
Binary Options Support Resistance Indicator This indicator is designed for binary options trading and effectively shows retracements from support and resistance levels. Signals appear on the current candle. A red arrow pointing downwards indicates a potential selling opportunity, while a blue arrow pointing upwards suggests buying opportunities. All that needs adjustment is the color of the signal arrows. It is recommended to use it on the M1-M5 timeframes as signals are frequent on these timef
Les acheteurs de ce produit ont également acheté
Neuro Poseidon MT4
Daria Rezueva
4.94 (18)
Neuro Poseidon is a new indicator by Daria Rezueva. It combines precise trading signals with adaptive TP/SL levels - creating best possible trades as a result! Message me and get  Neuro Poseidon Assistant  as a gift to automize your trading process! What makes it stand out? 1. Proven profitability on all assets and timeframes 2. Only confirmed BUY and SELL signals present on the chart 3. Adaptive TP & SL levels generated by the software for each trade 4. Easy to understand - suitable for all
Scalper Inside PRO
Alexey Minkov
4.74 (68)
Scalper Inside PRO Scalper Inside PRO is an intraday trend and scalping indicator for MetaTrader 4 that uses an exclusive algorithm to quickly detect market direction and key target levels. It automatically calculates entry, exit and multiple profit targets, and shows detailed performance statistics so you can see how different instruments and strategies performed. This helps you choose the most suitable trading instruments for the current market conditions. Additionally, you can easily integrat
M1 Sniper
Oleg Rodin
5 (23)
M1 SNIPER est un système d'indicateurs de trading facile à utiliser. Il s'agit d'un indicateur à flèche conçu pour l'unité de temps M1. Cet indicateur peut être utilisé seul pour le scalping sur l'unité de temps M1 ou intégré à votre système de trading existant. Bien que conçu spécifiquement pour le trading sur l'unité de temps M1, ce système peut également être utilisé avec d'autres unités de temps. Initialement, j'avais conçu cette méthode pour le trading du XAUUSD et du BTCUSD. Cependant, je
Gann Made Easy
Oleg Rodin
4.84 (164)
Gann Made Easy est un système de trading Forex professionnel et facile à utiliser qui est basé sur les meilleurs principes de trading en utilisant la théorie de mr. WD Gann. L'indicateur fournit des signaux d'ACHAT et de VENTE précis, y compris les niveaux Stop Loss et Take Profit. Vous pouvez échanger même en déplacement en utilisant les notifications PUSH. VEUILLEZ ME CONTACTER APRÈS L'ACHAT POUR RECEVOIR GRATUITEMENT DES INSTRUCTIONS DE TRADING ET D'EXCELLENTS INDICATEURS SUPPLÉMENTAIRES! Vou
Le système PRO Renko est un système de trading très précis spécialement conçu pour le trading de graphiques RENKO. Il s'agit d'un système universel qui peut être appliqué à divers instruments de négociation. Le système neutralise efficacement ce qu'on appelle le bruit du marché en vous donnant accès à des signaux d'inversion précis. L'indicateur est très facile à utiliser et n'a qu'un seul paramètre responsable de la génération du signal. Vous pouvez facilement adapter l'outil à n'importe que
Trend Catcher ind
Ramil Minniakhmetov
INDICATEUR DE DÉTECTEUR DE TENDANCE L'indicateur de détecteur de tendance analyse les mouvements de prix du marché grâce à une combinaison d'indicateurs d'analyse de tendance adaptatifs, propriétaires et personnalisés. Il identifie la véritable direction du marché en filtrant les fluctuations à court terme et en se concentrant sur la force de la dynamique sous-jacente, l'expansion de la volatilité et la structure des prix. Il utilise également une combinaison d'indicateurs personnalisés de lis
Trend Lines PRO
Roman Podpora
5 (1)
TREND LINES PRO     Cet indicateur permet de comprendre les véritables changements de direction du marché. Il révèle les renversements de tendance et les points de retour des principaux acteurs. Tu vois     Lignes BOS     Détection des changements de tendance et des niveaux clés sur des unités de temps supérieures, sans paramètres complexes ni interférences inutiles. Les signaux restent affichés sur le graphique même après la fermeture de la bougie. VERSION MT 5    -     Révèle son potentiel max
Enigmera
Ivan Stefanov
5 (8)
ENIGMERA : Le cœur du marché Important : La démo de MQL5.com fonctionne dans le Strategy Tester et peut ne pas refléter pleinement les fonctionnalités d'Enigmera. Consultez la description, les captures d'écran et la vidéo pour plus de détails. N'hésitez pas à m'envoyer un message si vous avez des questions ! Le code de l'indicateur a été entièrement réécrit. La version 3.0 ajoute de nouvelles fonctionnalités et corrige les bugs accumulés depuis le lancement de l'indicateur. Introduction Cet in
Dynamic Forex28 Navigator
Bernhard Schweigert
4.43 (7)
Dynamic Forex28 Navigator - L'outil de trading Forex de nouvelle génération. ACTUELLEMENT 49 % DE RÉDUCTION. Dynamic Forex28 Navigator est l'évolution de nos indicateurs populaires de longue date, combinant la puissance de trois en un : Advanced Currency Strength28 Indicator (695 avis) + Advanced Currency IMPULSE avec ALERT (520 avis) + CS28 Combo Signals (Bonus). Détails sur l'indicateur https://www.mql5.com/en/blogs/post/758844 Qu'offre l'indicateur de force de nouvelle génération ? Tout
Genesis Matrix Pro is a professional multi-timeframe trend detection indicator designed to help traders identify high-quality market alignment with clarity and structure. It combines 12 different technical indicators into one visual alignment matrix, allowing traders to quickly see when market conditions are bullish, bearish, or neutral. A signal is generated only when the selected strategies are aligned, helping reduce noise and improve decision-making. PLEASE CONTACT ME AFTER PURCHASE TO GET
Cet indicateur est un indicateur d'analyse automatique des vagues, parfait pour le trading pratique ! Cas... Remarque :   je n'ai pas l'habitude d'utiliser des noms occidentaux pour l'évaluation des vagues. En raison de l'influence de la convention de dénomination de Tang Lun (Tang Zhong Shuo Zen), j'ai nommé la vague de base comme   un stylo   et la bande d'onde secondaire comme   un segment   . en même temps, le segment a la direction de la tendance.Le   segment de tendance principal   est no
RFI levels PRO
Roman Podpora
5 (1)
L'indicateur montre avec précision les points de retournement et les zones de retour des prix où le       Acteurs majeurs   . Vous repérez les nouvelles tendances et prenez des décisions avec une précision maximale, en gardant le contrôle de chaque transaction. VERSION MT5     -     Révèle son potentiel maximal lorsqu'il est combiné à l'indicateur   TREND LINES PRO Ce que l'indicateur montre : Structures et niveaux d'inversion avec activation au début d'une nouvelle tendance. Affichage des nive
Ce produit a été mis à jour pour le marché 2026 et optimisé pour les dernières versions de MT5. AVIS DE MISE À JOUR DU PRIX : Smart Trend Trading System est actuellement disponible à $99 . Le prix passera à $199 après les 30 prochains achats . OFFRE SPÉCIALE : Après avoir acheté Smart Trend Trading System, envoyez-moi un message privé pour recevoir Smart Universal EA GRATUITEMENT et transformer vos signaux Smart Trend en trades automatisés. Smart Trend Trading System est un système de trading c
MTF Supply Demand Zones
Georgios Kalomoiropoulos
4.82 (22)
Nouvelle génération de zones d'approvisionnement et de demande automatisées. Algorithme nouveau et innovant qui fonctionne sur n'importe quel graphique. Toutes les zones sont créées dynamiquement en fonction de l'action des prix du marché. DEUX TYPES D'ALERTES --> 1) QUAND LE PRIX ATTEINT UNE ZONE 2) QUAND UNE NOUVELLE ZONE SE FORME Vous n'obtenez pas un indicateur inutile de plus. Vous obtenez une stratégie de trading complète avec des résultats prouvés.     Nouvelles fonctionnalités:   
PZ Trend Trading
PZ TRADING SLU
4.8 (5)
Capture every opportunity: your go-to indicator for profitable trend trading Trend Trading is an indicator designed to profit as much as possible from trends taking place in the market, by timing pullbacks and breakouts. It finds trading opportunities by analyzing what the price is doing during established trends. [ Installation Guide | Update Guide | Troubleshooting | FAQ | All Products ] Trade financial markets with confidence and efficiency Profit from established trends without getting whips
Step into the world of Forex trading with confidence, clarity, and precision using   Gold Indicator   a next-generation tool engineered to take your trading performance to the next level. Whether you’re a seasoned professional or just beginning your journey in the currency markets, Gold Indicator equips you with powerful insights and help you trade smarter, not harder. Built on the proven synergy of three advanced indicators, Gold Indicator focuses exclusively on medium and long-term trends eli
Entry Points Pro
Yury Orlov
4.59 (174)
Indicateur supérieur pour MT4 fournissant des signaux précis pour entrer dans un trade sans repeindre ! Il peut être appliqué à tous les actifs financiers : forex, cryptocurrencies, métaux, actions, indices.  La version MT5 est ici Il fournira des signaux de trading assez précis et vous dira quand il est préférable d'ouvrir un trade et de le fermer. Regardez la vidéo (6:22) avec un exemple de traitement d'un seul signal qui a rapporté à l'indicateur ! La plupart des traders améliorent leurs
MetaBands M4
Vahidreza Heidar Gholami
3.5 (6)
MetaBands uses powerful and unique algorithms to draw channels and detect trends so that it can provide traders with potential points for entering and exiting trades. It’s a channel indicator plus a powerful trend indicator. It includes different types of channels which can be merged to create new channels simply by using the input parameters. MetaBands uses all types of alerts to notify users about market events. Features Supports most of the channel algorithms Powerful trend detection algorith
Version Swing M30/H1/H4 disponible Attraper les grands mouvements ? Gold Signal Swing Pro (M30/H1/H4). Objectif : $20-$80+ par trade. https://www.mql5.com/en/market/product/177643 KURAMA GOLD SIGNAL PRO (MT4) — Système de Trading XAUUSD Complet avec Filtre à 7 Couches, TP/SL Automatique et Notation de Qualité PAS DE REPAINT. PAS DE REDESSIN. PAS DE RETARD. Chaque signal est permanent. Ce que vous voyez est ce que vous obtenez. BONUS : Achetez la lice
Current event:  https://c.mql5.com/1/326/A2SR2025_NoMusic.gif A. Qu'est-ce que l'A2SR ?   * C'est un indicateur technique avancé (pas de peinture, pas de retard). -- Conseils : -- sur https://www.mql5.com/en/blogs/post/734748/page4#comment_16532516 -- et https://www.mql5.com/en/users/yohana/blog A2SR a une technique spéciale pour déterminer les niveaux de Support (demande) et de Résistance (offre). Contrairement à la manière ordinaire que nous avons vue sur le net, A2SR a un concept original
BTMM State Engine Pro is a MetaTrader 4 indicator for traders who use the Beat The Market Maker approach: Asian session context, kill zone timing, level progression, peak formation detection, and a multi-pair scanner from a single chart. It combines cycle state logic with a built-in scanner dashboard so you do not need the same tool on many charts at once. What it does Draws the Asian session range; session times can follow broker server offset or be set in inputs. Tracks level progression (L
Quant Direction
Georgios Kalomoiropoulos
Quant Direction est un outil d'analyse de marché 3D. Il fournit une analyse de marché parfaitement objective, basée sur un algorithme, en calculant des écarts précis en pourcentage sur différents paramètres. Développé à l'aide d'outils de modélisation avancés basés sur l'IA et soumis à des tests rigoureux, cet algorithme analyse le marché avec une précision inégalée. Vous pouvez analyser n'importe quelle paire de devises ou instrument financier sur la plateforme. Que vous pratiquiez le trading à
MonsterDash Harmonic Indicator is a harmonic pattern dashboard. It recognizes all major patterns. MonsterDash is a dashboard that displays all detected patterns for all symbols and (almost) all timeframes in sortable and scrollable format. Users can add their own user defined patterns . MonsterDash can open and update charts with the pattern found. Settings MonsterDash's default settings are good enough most of the time. Feel free to fine tune them to your needs. The color settings are for thos
NAM Order Blocks
NAM TECH GROUP, CORP.
3.67 (3)
MT4 Multi-timeframe Order Blocks detection indicator. Features - Fully customizable on chart control panel, provides complete interaction. - Hide and show control panel wherever you want. - Detect OBs on multiple timeframes. - Select OBs quantity to display. - Different OBs user interface. - Different filters on OBs. - OB proximity alert. - ADR High and Low lines. - Notification service (Screen alerts | Push notifications). Summary Order block is a market behavior that indicates order collection
PowerBall Signals est un indicateur de signaux d'ACHAT/VENTE basé sur l'idée d'utiliser des zones de support/résistance. L'indicateur détecte des modèles d'inversion spéciaux basés sur les zones de support/résistance et fournit ces signaux sur votre graphique. L'idée principale de l'indicateur est d'utiliser l'analyse MTF (Multi Time Frame) et de fournir des signaux basés sur les niveaux de votre période actuelle et suivante. Cette méthode permet de prédire d’éventuels retournements de prix sur
Auto Optimized Parabolic RSI : Moteur de Momentum 3D Avancé La plupart des indicateurs pour les particuliers échouent car ils s'appuient sur des paramètres statiques qui se brisent dès que la volatilité du marché change. L'Auto Optimized Parabolic RSI résout le problème de l'« obsolescence des indicateurs » en recalculant continuellement son propre avantage mathématique, apportant une adaptation quantitative de niveau institutionnel directement sur votre terminal MT5. L'Avantage Principal : Opti
Volume Master – Real-Time Market Power Indicator See who’s in control of the market: buyers or sellers in real time. Volume Master is a powerful trading tool designed to give you a clear edge by visualizing bull vs bear activity across multiple symbols, while helping you confirm high-probability entries directly on your chart. WHAT MAKES VOLUME MASTER DIFFERENT? Unlike traditional volume indicators, Volume Master doesn’t just show volume — it shows market dominance. Real-Time Bull vs Bear Activi
Signal GoldRush Trend Arrow L'indicateur GoldRush Trend Arrow Signal fournit une analyse précise et en temps réel des tendances, spécialement conçue pour les scalpers à haute vitesse et à court terme sur la paire XAU/USD. Conçu spécialement pour les intervalles de temps d'une minute, cet outil affiche des flèches directionnelles indiquant clairement les points d'entrée, ce qui permet aux scalpers de naviguer en toute confiance dans des conditions de marché volatiles. L'indicateur se compose
PZ 123 Pattern
PZ TRADING SLU
1 (1)
Unlock powerful breakout opportunities The 123 Pattern is one of the most popular, powerful and flexible chart patterns. The pattern is made up of three price points: a bottom, a peak or valley, and a Fibonacci retracement between 38.2% and 71.8%. A pattern is considered valid when the price breaks beyond the last peak or valley, moment at which the indicator plots an arrow, rises an alert, and the trade can be placed. [ Installation Guide | Update Guide | Troubleshooting | FAQ | All Products  ]
Bull versus Bear
Mohamed Hassan
4.5 (18)
Send us a message after your purchase to receive more information on how to get your  BONUS  for FREE  that works in great combination with Bull vs Bear ! Bull versus Bear is an easy-to-use Forex indicator that gives traders clear and accurate signals based on clear trend retests . Forget about lagging indicators or staring at charts for hours because  Bull vs Bear provides real-time entries with no lag and no repaint, so you can trade with confidence. Bull vs Bear  helps you enter trades during
Plus de l'auteur
Power Renko is an indicator which plots Renko bricks underneath the chart using a histogram. You can select the brick size and the timeframe of the Renko bricks as well as whether or not to use the close price or the high/low price of the candles. Renko bricks are based on price alone, not time, therefor the Renko bricks will not be aligned with the chart's time. They are extremely useful for trend trading and many different strategies can be formed from them. Buffers are provided allowing you t
This indicator displays the historical bid and ask prices on the chart. This is an extremely useful tool for watching the spread rise and fall, as well as watching to see whether or not the bid and ask prices are converging or diverging. This tool will allow you to enter the market at just the right time. This indicator will help you stay out of the market when the spread begins to rise and help you get into the market as the spread begins to fall again. ON SALE FOR FREE, GET IT FREE FOR A LIMI
FREE
Spread Indicator MT4
Pierce Vallieres
4 (2)
This indicator displays the historical spread values on the chart. This is an extremely useful tool for watching the spread rise and fall, allowing you to enter the market at just the right time. This indicator will help you stay out of the market when the spread begins to rise and help you get into the market as the spread begins to fall again. ON SALE FOR FREE, GET IT FREE FOR A LIMITED TIME ONLY
FREE
RSI Bands MT4
Pierce Vallieres
RSI Bands is a powerful indicator which displays an upper and lower band corresponding to the RSI overbought and oversold levels. The band shows what price must be reached during that specific candle in order for the RSI overbought/oversold level to be reached. This is an extremely useful tool for spotting when a trend has begun and when a trend is about to end. The indicator provides buffers, allowing you to use it in your own Expert Advisor. Please message me if you have any questions. CURREN
FREE
Martian RSI EA
Pierce Vallieres
Martian RSI is an EA which detects RSI divergences and places trades accordingly. The EA is optimized for trading GBPUSD and NDAQ100 on the daily timeframe. The EA is designed for medium to longterm investing. Simply deposit funds into your account, adjust risk settings to fit your personal risk tolerance and then watch your account grow exponentially over time. - Follows FIFO rules - No Martingale - Optional Grid Default settings are for HIGH RISK strategy on NDAQ100 daily. Please PM me for s
This indicator places a moving average of the specified type over the standard RSI indicator. This is an extremely useful tool for spotting reversal points and RSI divergences. This indicator provides buffers, allowing you to use it in your expert advisor. I like to make the RSI period the same as the moving average period, but it is up to you to set it up however you would like.
Neptune Multiplex EA is an expert advisor which is designed to be capable of trading many different types of strategies all in one EA. Many different indicators can be used in many different combinations and on many different timeframes simultaneously. The EA can easily be optimized in the strategy tester. Martingale is optional, and is not necessary in order to create a set of parameters which can generate profits. If you need a set file use on from the comments or message me. I offer lifetime
RSI Divergence Detector is an RSI indicator which also detects divergences and plots arrows and trend lines on the chart where you should buy and sell. Please note that this indicator provides 5 buffers and doesn't repaint making it an exceptional indicator for Expert Advisors. The indicator also provides alerts. Buffer 0 = RSI Buffer 1 = Buy Buffer 2 = Sell Buffer 3 = RSIGradient Buffer 4 = PriceGradient NON REPAINTING DIVERGENCE DETECTION
PV Harmonics
Pierce Vallieres
PV Harmonics - Paints harmonic triangles and patterns on live charts to show current live harmonic patterns. - Paints arrows on charts over the harmonic patterns to signal prime entry and exit points. - Extremely fast and versatile indicator. - Highly accurate. - Non repainting. (Does not repaint entry/exit signals) - Comes with numerous customization settings.
PV Super Trend Signals - Detects Key Points of Reversals - Enters Trades at Key Points - Closes Trades at Accurate Levels - Extremely accurate - Great for almost every currency - Amazing for EURUSD H1 - Backtested across many currencies over many years on many timeframes - H1 is the best timeframe - Can be used to make stable profit - Can be used to hedge other trading robots - ReInvest with Risk and Leverage features if desired - Backtested accurately across many currencies using tick data -
MACD Pro
Pierce Vallieres
MACD Pro - Features a built-from-scratch overhauled MACD indicator - Signals Buy and Sell Zones - Uses an exceptional noise cancelling filter - Signals up trends and down trends - Precise and accurate signals MACD Pro is an indicator built from the ground up and is designed to signal optimal buy and sell zones. Take buy trades in the buy zones and sell trades in the sell zones. It includes a noise cancelation feature which rivals the best products on the market.
Rainbow Ribbon
Pierce Vallieres
Rainbow Ribbon - Rainbow MA bands - Useful for spotting trend changes - Useful for spotting trend slopes - Useful for spotting trend acceleration - Ability to choose ribbon colors, moving averages, and distances - Provides colorful rainbow ribbons to show an array of moving averages Rainbow Ribbon is an extremely useful indicator, it has been designed to make it easy to spot the trend and also changes within the trend before they occur. It can be used many different ways and provides the abili
Starkiller Grid Trader Starkiller Grid Trader is a MT4 trading robot which specializes in the management of grid trading systems. A very large variety of customizable settings are included to make sure that you are able to place grid trades on any currency pair, stock, index or commodity automatically according to your own liking. Starkiller is accurate, versatile and robust. - Includes numerous grid trading settings - Includes the ability to select open/close indicators - Includes color coded
RSI Pro Indicator - Shows accurate RSI signals with modifiable price applications - Shows accurate RSI overbought and oversold levels - Shows multiple timeframe RSI overbought and oversold conditions on a single chart - 3 green bar sections in a row is an uptrend pattern - 3 red bar sections in a row is a downtrend pattern The RSI Pro Indicator is a highly useful tool for determining overbought and oversold conditions and spotting RSI patterns, as well as spotting overbought and oversold condi
Super Trend Double Pro - Includes the classic SuperTrend indicator x2 - Includes two indicators for much better market analysis - Comes with various settings - Comes with a display - Displays statistical win/loss information The "Super Trend Double Pro" indicator provides the ability to combine two of the classic SuperTrend indicators into one, displaying two indicators with different settings on the same chart. The indicator comes with many customizable settings as well as a display which sh
RSI Divergence Detector is an RSI indicator which also detects divergences and plots arrows and trend lines on the chart where you should buy and sell. Please note that this indicator provides 5 buffers and doesn't repaint making it an exceptional indicator for Expert Advisors. The indicator also provides alerts. Buffer 0 = RSI Buffer 1 = Buy Buffer 2 = Sell Buffer 3 = RSIGradient Buffer 4 = PriceGradient NON REPAINTING DIVERGENCE DETECTION
MACD Divergence Detector MT5 - Non-repainting  - Live divergence detection - Accurate MACD indicator - Includes 10 indicator buffers - EA friendly - Includes useful customizable settings - Decide which buffers to display on the chart and their colors The MACD Divergence Detector for MT5 is an accurate and useful tool for detecting and displaying MACD divergences and good places to take long and short trades. It includes 10 buffers and customizable settings. This tool does not repaint and can
Filtrer:
Aucun avis
Répondre à l'avis