VWAP with Standarddeviation
- Indicateurs
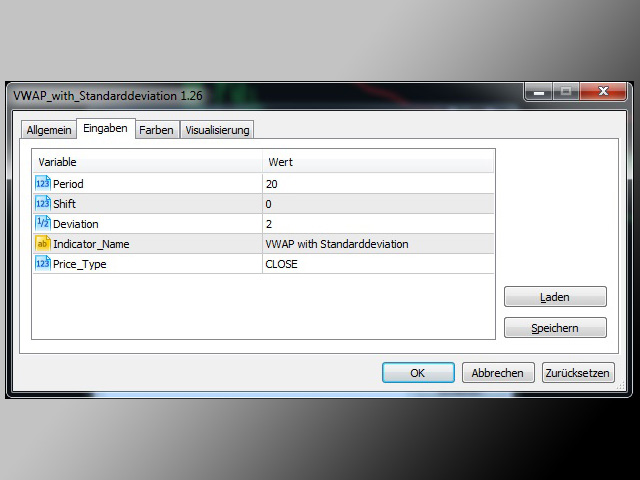
- Version: 1.26
- Activations: 5
VWAP = Volume Weighted Average Price
The concept of VWAP is not equal to a normal Moving Average. The VWAP starts always with zero at the beginning of a new day and successively forms an average to the traded volume relative to price. Professional trading firms and institutions use VWAP for a measure of the real weighted trend of an underlying.
With the addition of the standard deviation you can spot support and resist at the outer boundaries.