Bloc Convergence Price
- Indicateurs
- Version: 1.0
- Activations: 20
The block of bars is collected under condition of convergence. If the convergence conditions are not met, the block is deleted. More precisely, the condition is the transition of the block of bars from the state of convergence to the state of divergence. Blocks are formed selectively with gaps. Gaps are characterized by the state of divergence of bars.
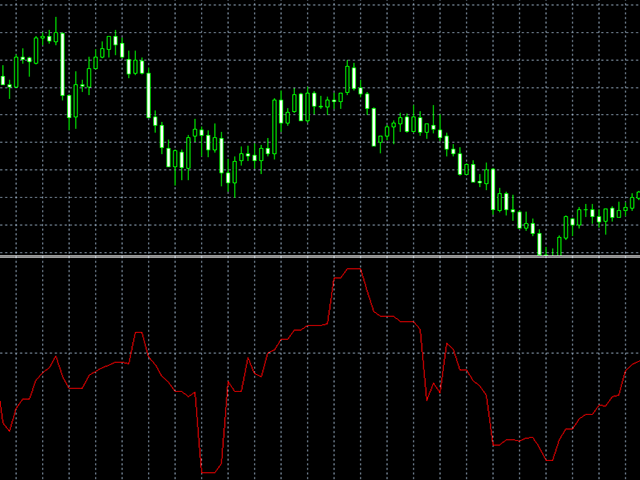
The indicator shows
the value and direction of the price in the convergence block.
To determine the convergence value, see here, the line of extreme bars inside
the block, see here.
To form a block under the condition of divergence, see here.
The indicator has no settings.