Excessive Momentum Indicator MT4
- Indicateurs
-
Young Ho Seo
 Harmonic Pattern Indicator - Repainting + Japanese Candlestick Pattern Scanner + Automatic Channel + Many more
https://www.mql5.com/en/market/product/4488 - Version: 12.3
- Mise à jour: 4 mars 2022
- Activations: 5
Introduction
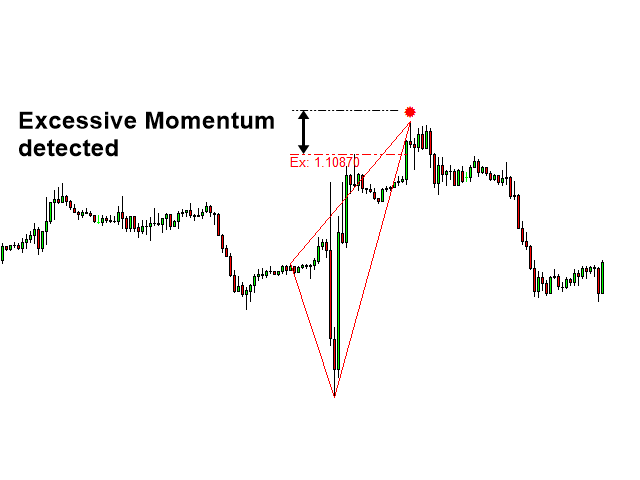
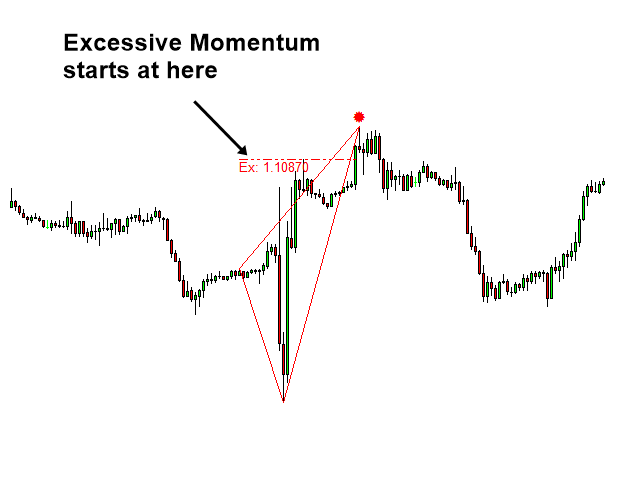
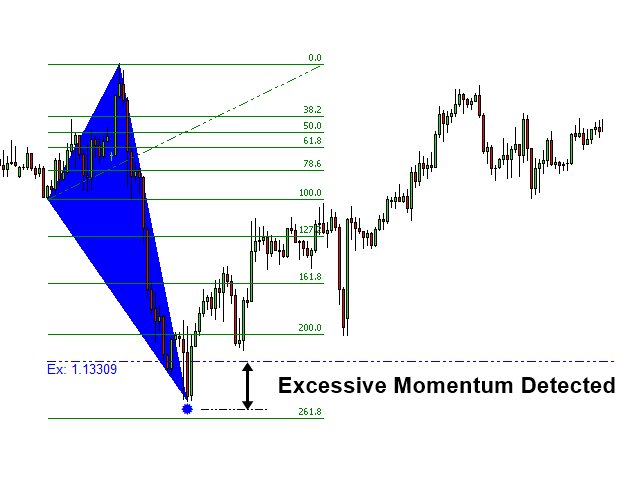
Excessive Momentum Indicator is the momentum indicator to measure the excessive momentum directly from raw price series. Hence, this is an extended price action and pattern trading. Excessive Momentum Indicator was originally developed by Young Ho Seo. This indicator demonstrates the concept of Equilibrium Fractal Wave and Practical Application at the same time. Excessive Momentum detects the market anomaly. Excessive momentum will give us a lot of clue about potential reversal and breakout opportunity. The great advantage of Excessive momentum is that it is simple and easy to use. It can go well with most of known techncial analysis including trend indicators, oscillators, Fibonacci trading, harmonic pattern trading, volume spread analysis, Elliott Wave pattern, etc.
Input Settings
A. Indicator settings
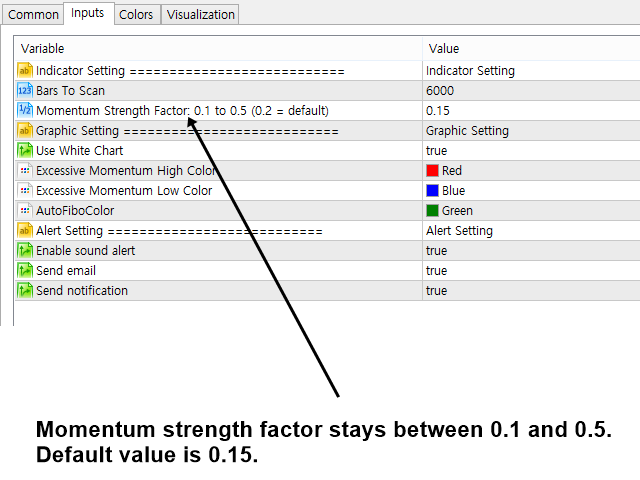
- Bars To Scan: amount of candle bars to calculate the indicator
- Momentum Strength Factor: Momentum Strength is the strength of Excessive Momentum to detect. It stays between 0.1 and 0.5. In theory it can go up to 1.0. But you will not get many signals to trade. The default setting is 0.1. You can try various Momenum Strength Factor to optimize your trading performance if you wish.
- Equilibrium Fractal Wave Scale: This input controls the size of Fractal Wave when we detect the excessive momentum. If you put bigger number, then you get less signals to trade. The default setting is 0.5.
B. Graphic settings
- Use White Chart: to use white chart, set to true, otherwise, just set to false
- Excessive Momentum High Color: Excessive Momentum line color when peak (high) is detected
- Excessive Momentum Low Color: Excessive Momentum line color when trough (low) is detected
- Auto Fibo Color: Color of Automatic Fibnacci Retracment in your chart
How to use
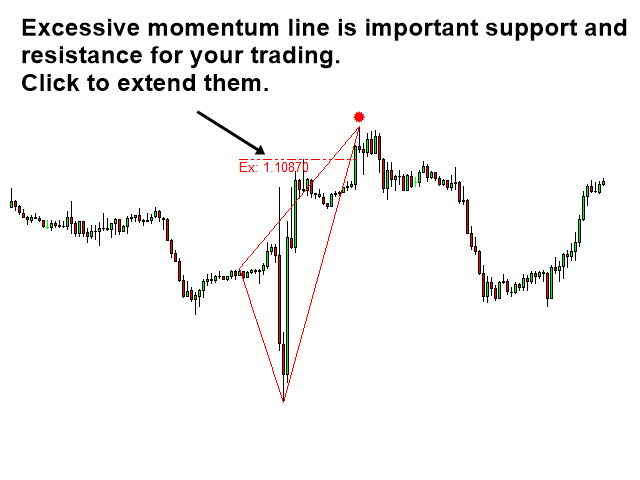
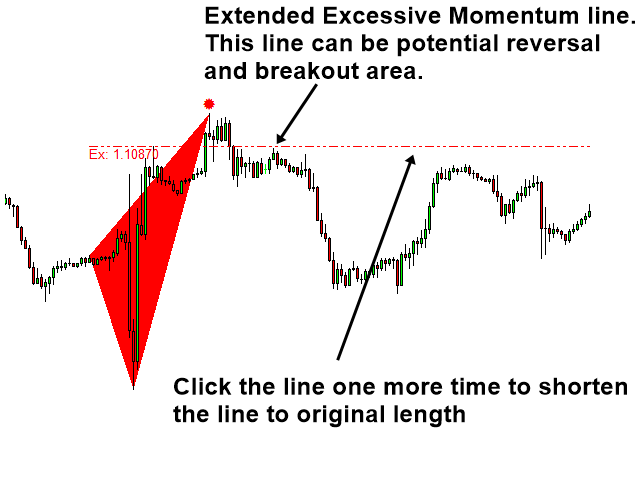
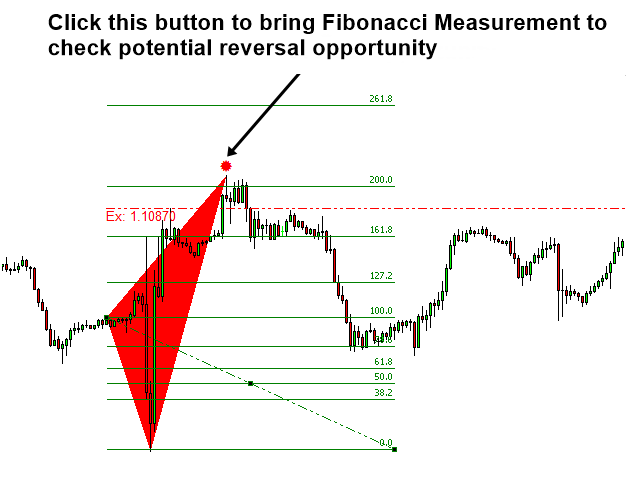
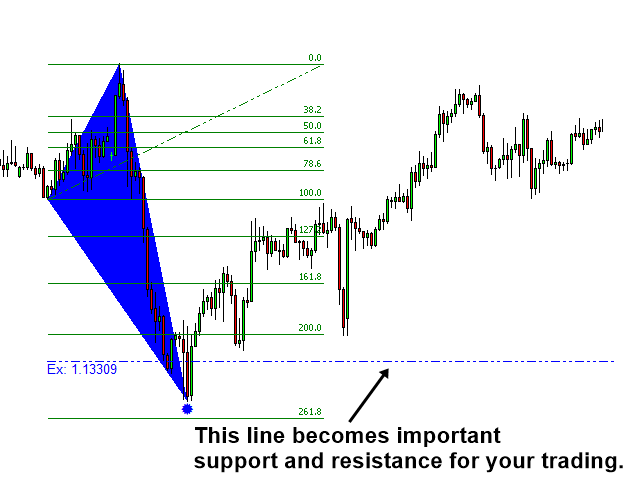
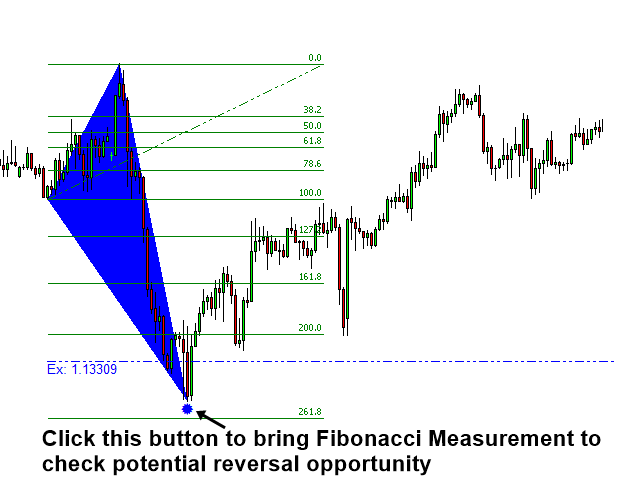
In the indicator, we provide the automatic Fibonacci retracement to gauge the potential reversal opportunity. Hence, you can readily combine the classic Fibonacci trading setup with our Excessive momentum indicator. Do remember that excessive momentum line is the important support and resistance for your trading. Even though you have measured the Fibonacci ratio correctly for the potential reversal opportunity, the price must cross the excessive momentum line for confirmation. Sometimes, price can bounce off from the excessive momentum line. In this case, we get another reversal trading opportunity from excessive momentum line. Just treat the excessive momentum line as sensible support and resistance for your trading.
Some additional tools to help your trading
With excessive momentum indicator, oscillators like RSI and CCI can be used as secondary confirmation tools. This is the basic requirement for your trading.
With Harmonic Pattern and Elliott Wave pattern
If you want to use Excessive momentum indicator together with Harmonic pattern or Elliott Wave pattern, just replace the Fibonacci retracement with your harmonic pattern or Elliott wave pattern measurement (you will need to use external software for this). Alternatively, you can use Fibonacci retracement together with Harmonic pattern and Elliott wave pattern if you wish.
Trading Strategy Guide
If you want to use Excessive momentum indicator, we also provide the volume spread anlaysis tool kit to assit further with your momentum trading. The volume spread analysis tool kit is available for both free and paid version. You can find the details about them from the link below:
Strategy Guide 1: https://www.mql5.com/en/blogs/post/750346
Strategy Guide 2: https://www.mql5.com/en/blogs/post/750390
Important Note
This is the off the shelf product. Therefore, we do not accept any modification or customization request on this product. In addition, we do not provide any code library or any support for your coding for this product.

There are many reversal product in market but this excessive momentum reversal is really very accurate, upon recieve signal just need to wait for 10-20 minutes on lower timeframe m1/m5, it repaint but it works, most indicator out there in the market repaint but that doesn't mean doesn't work as indicator get 50% of job done remaining 50% one need to apply TA and be patience to wait for confluence before entry and exit, am happy with the purchase and bought both mt4+mt5. Thanks author for another quality product 5 stars!