Precision Support Resistance MT4
- Indicateurs
-
Young Ho Seo
 Harmonic Pattern Indicator - Repainting + Japanese Candlestick Pattern Scanner + Automatic Channel + Many more
https://www.mql5.com/en/market/product/4488 - Version: 7.3
- Mise à jour: 28 février 2022
- Activations: 5
Introduction to Support Resistance Indicator
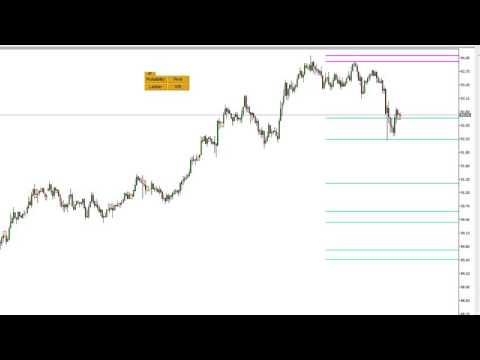
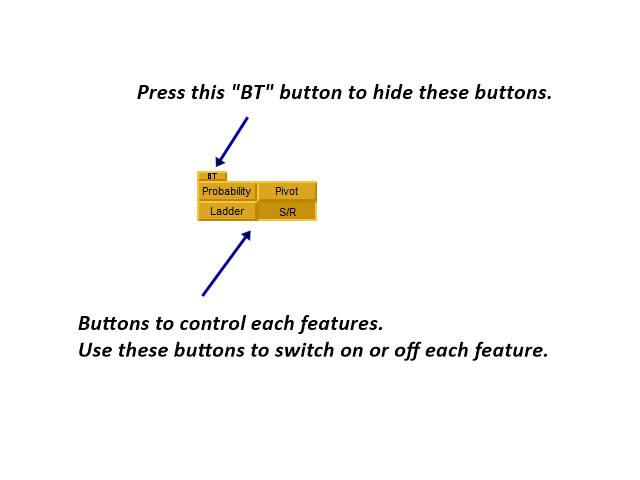
Support and Resistance are the important price levels to watch out during intraday market. These price levels are often tested before development of new trend or often stop the existing trend causing trend reversal at this point. Highly precise support and resistance are indispensable for experienced traders. Many typical trading strategies like breakout or trend reversal can be played well around these support and resistance levels. The Precision Support and Resistance are highly accurate support and resistance tools designed for serious traders. In addition to accurate support and resistance level detection, the Precision Support and Resistance provides additional four features to aid your winning trading. They include decision candle detection, Intra Candle Probability Calculation, Pivot Analysis and Ladder Analysis. Any of these features can be switched on and off for your preferences.
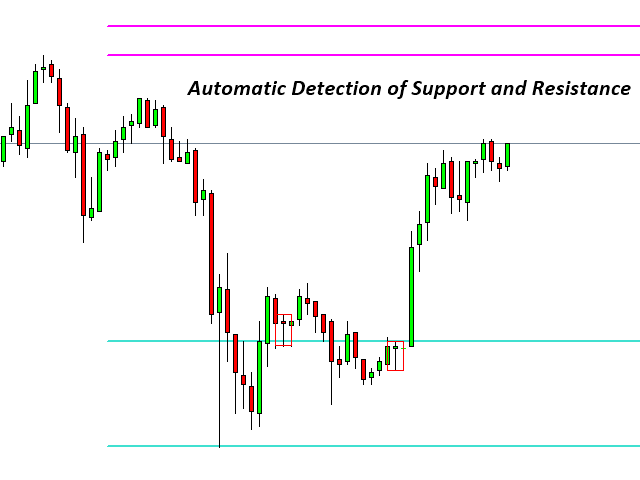
Support and Resistance
We use the density and geometry approach to compute support and resistance levels. Quite often you will observe that detected support and resistance levels predict very accurately where price penetrate hard or where price reverse back hard. According to you preference, some sensible trading strategy can be developed.
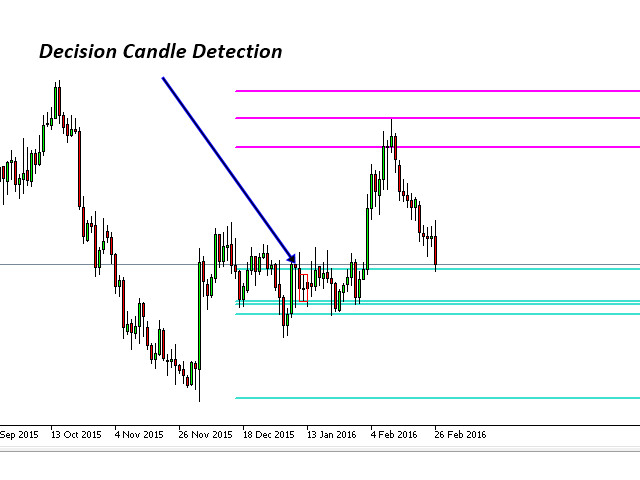
Decision Candle Detection
Decision candle detection module alerts traders the possible big movement. Decision candle is the typical pattern appearing before onset of the strong reversal or strong continuation of the current trend. Therefore, it is recommended to watch out the appearance of this decision candle in your trading especially if they are around important support and resistance level.
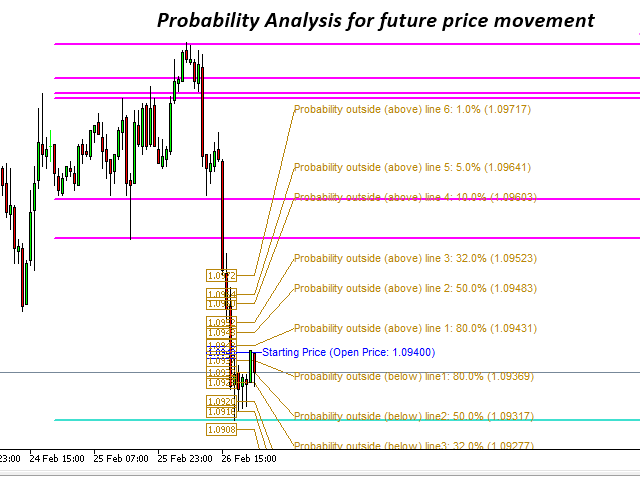
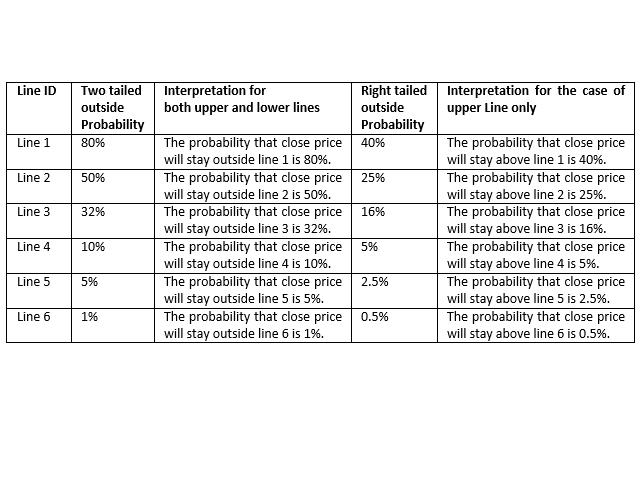
Intra-Candle Probability Calculation
Intra-Candle probability is the statistical prediction of future range of close price for projected horizon. This tool will display 1%, 5%, 10%, 32%, 50%, 80% levels. The pair of lines will be drawn above and below the open price of the current candle. 50% probability means that the chance of the close price being outside this lines is the 50% from open price of the candle. Instead of doing some guess work, you can precisely estimate when the price will touch support and resistance level or when the price will touch moving average line or when the price will touch Bollinger band lines, etc.
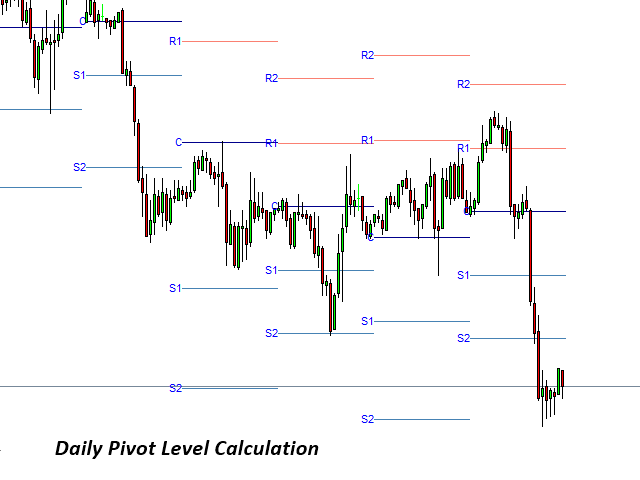
Pivot Analysis
We added the standard pivot analysis technique. Pivot analysis can be used in two purposes. First, you can use pivot level to double confirm support and resistance levels. Second, you can use pivot level to confirm rough trend if that is your interest. For example, if price closed below S1 or S2 yesterday, then you can say that current trend is downmarket. The built in Pivot analysis provide daily pivot only and you can choose how many number of days you want to display the pivot levels.
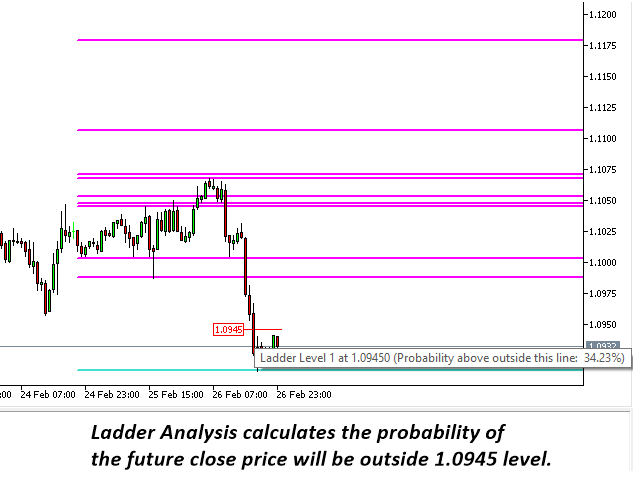
Ladder Analysis
Simply speaking ladder analysis will answer the question like what is the probability of the close price will stay outside the specified level of your interest. For example, you believe that the level 1.2400 is important and you want to find out what is the chance of the close price will actually end above this important level. Then you can use this Ladder Analysis to find the probability.
Input Setting
Default setting works well for most of currency pairs and timeframes. Changing input parameters are extremely simple and self explanatory as usual. Most of time you will use default settings.
Trading Strategy Guide
You can use Precision Support Resistance together with any of following technical analysis.
Guide for Support Resistance Indicator (Main Strategy Guide)
Guide for Volume Spread Analysis
Guide for Harmonic Pattern Detection Indicator
Guide for Supply Demand Indicator
Guide for Triangle Pattern, Falling Wedge Pattern, Rising Wedge Pattern and Channel
Guide for Elliott Wave Indicator
Important Note
This is the off the shelf product. Therefore, we do not accept any modification or customization request on this product. In addition, we do not provide any code library or any support for your coding for this product.


Usefull tool.
This is 4th tool i buy from Young Ho Seo :)