Master Trading Matrix
- Indicateurs
-
Jeffrey Lloyd Lauzon
 Welcome to themt4developer!
I am a C++ systems programmer and specialized MQL4 developer focused on building professional-grade trading utilities, custom indicators, automated Expert Advisors, and advanced chart dashboards for MetaTrader. - Version: 1.3
Master Trading Matrix (Free Advanced Multi-Indicator Dashboard)
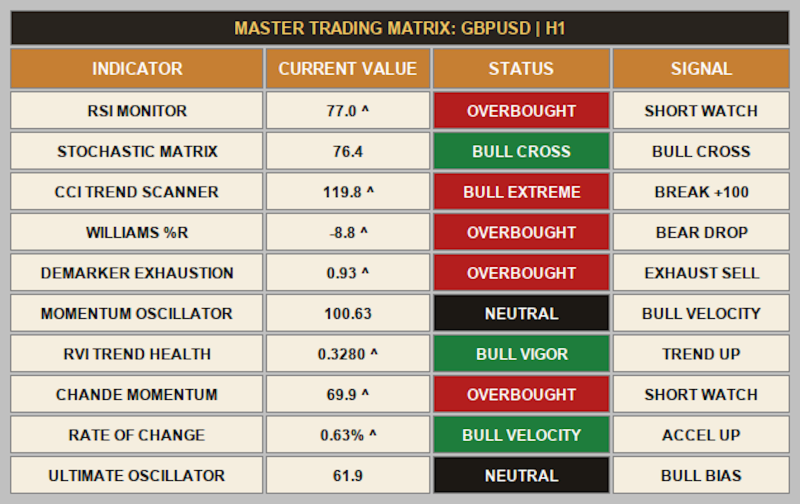
The Master Trading Matrix is an institutional-grade technical convergence scanner designed to combine 10 foundational momentum, trend, and exhaustion engines into a single, unified execution display. By integrating RSI, Stochastic, CCI, Williams %R, DeMarker, Momentum, RVI, Chande Momentum, Rate of Change, and Ultimate Oscillator into an executive matrix, this utility eliminates multi-window clutter and provides a complete, real-time picture of asset health on your active chart and timeframe.
Instead of switching between multiple separate analytical windows, the Master Trading Matrix continuously polls all 10 systems concurrently. It dynamically translates complex mathematical boundaries into clear visual states, color-coded zones, and instant tactical bias triggers.
💎 Core Technical Features
* Unified 10-Indicator Convergence Matrix: Simultaneously monitors 10 elite analytical models (RSI, Stochastic, CCI, Williams %R, DeMarker, Momentum, RVI, CMO, ROC, Ultimate Oscillator) on a single streamlined dashboard.
* Active Timeframe Context Display: Automatically tracks and displays the chart symbol and active timeframe directly in the dynamic title banner (e.g., GBPUSD | H1).
* Dynamic Color-Coded State Machine: Instantly adapts to market conditions with high-visibility color blocks—deep red transitions for Overbought/Extreme zones, deep green blocks for Oversold/Vigor zones, and dark slate for neutral baseline states.
* Actionable Signal Outputs: Translates multi-model math into explicit trading actions, including SHORT WATCH, LONG WATCH, BULL CROSS, BREAK +100, EXHAUST SELL, and ACCEL UP triggers.
* Institutional "Clean Workspace" Toggle: Includes a clean UI parameters layout that masks background market noise, grids, scales, and axes to give you an uncluttered workspace dedicated strictly to matrix scanning.
* Zero Terminal Lag / High Performance Architecture: Engineered with optimized, low-overhead array loops that execute smoothly, completely avoiding terminal lag on Linux/Wine, VPS, or native Windows architectures.
📈 Interactive Status & Interpretation Logic
The dashboard tracks live indicator outputs across all 10 sub-systems and evaluates threshold boundaries explicitly into structural bias matrices:
* Overbought / Bearish Extremes: Cells transition to deep red (OVERBOUGHT / BULL EXTREME) with upward directional flags (^), shifting signals into SHORT WATCH, BEAR DROP, or EXHAUST SELL.
* Oversold / Bullish Extremes: Cells transition to deep green (OVERSOLD / BULL VIGOR) with directional flags, shifting signals into LONG WATCH, BULL CROSS, or EXHAUST BUY.
* Neutral / Structural Biases: Cells display baseline metrics with a dark neutral slate background, maintaining clear structural BULL BIAS or BEAR BIAS conditions.
🛠️ Fully Modular Input Parameters
Tailor every calculation model completely to your personalized trading strategy directly through the comprehensive input dashboard:
* RSI Configuration (`InpRSI_Period`, `OB`, `OS`): Standard 14-period default with customizable overbought/oversold limits.
* Stochastic Configuration (`InpStoch_K`, `D`, `Slow`, `OB`, `OS`): Precise %K and %D crossover tracking inputs.
* CCI Configuration (`InpCCI_Period`, `OB`, `OS`): Institutional $\pm 100$ deviation boundary settings.
* Williams %R Configuration (`InpWPR_Period`, `OB`, `OS`): Rapid high-low range momentum shift parameters.
* DeMarker Configuration (`InpDeM_Period`, `OB`, `OS`): Exhaustion threshold adjustments (0.7 / 0.3).
* Momentum & Velocity Parameters: Adjustable lookback windows for Momentum, RVI, CMO, ROC, and multi-period weighted Ultimate Oscillator loops.
* Display Settings (`InpHideChart`, `InpCorner`, `InpXOffset`, `InpYOffset`): Complete control over visual cleanliness, background suppression, and screen coordinate anchoring.