Dynamic Volume ProfileDelta
- Indicateurs
- Version: 1.8
- Mise à jour: 3 octobre 2026

Dynamic Volume Profile/Delta
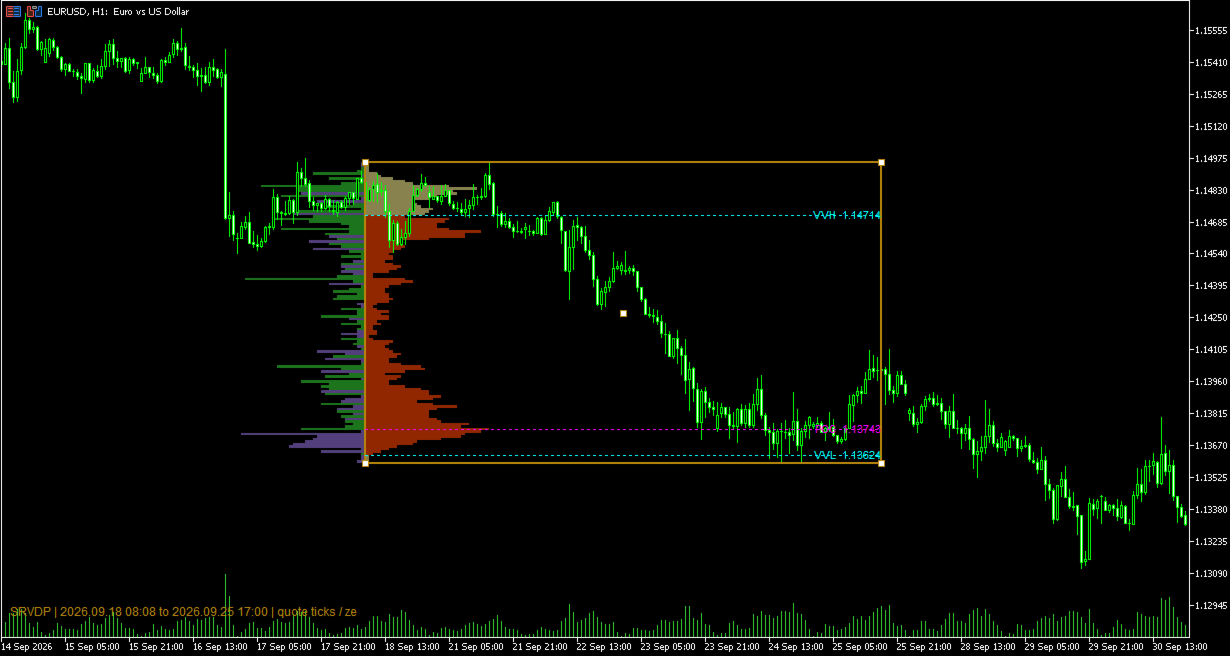
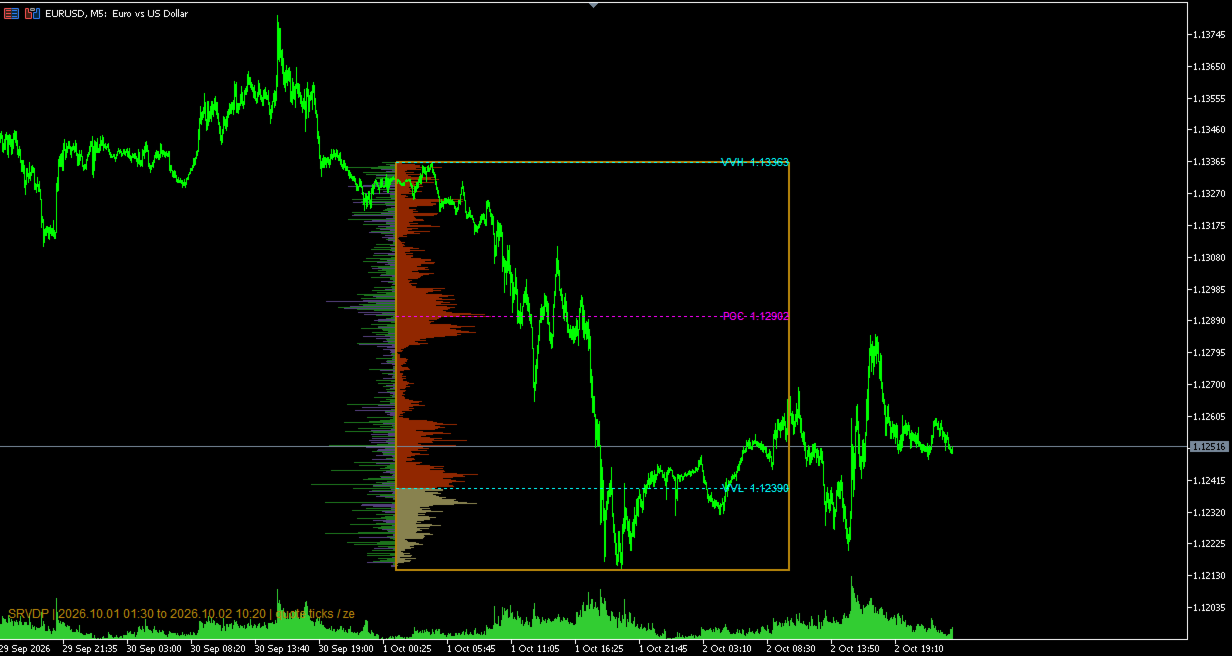
Selected Range Volume Delta Profile displays volume distribution and estimated delta within a user-defined chart range. Move or resize the selection rectangle to analyze a different period. The indicator plots the volume profile, positive and negative delta, Point of Control (POC), and Value Area Low and High levels (VVL and VVH).
Profiles can be calculated from quote ticks or lower-timeframe bars, with support for tick or real volume when available. Adjustable options include the number of price rows, value area percentage, volume allocation method, profile widths, live preview, level projection, labels, colors, line styles, and initial selection size.
Adjustable Options
Data and Calculation
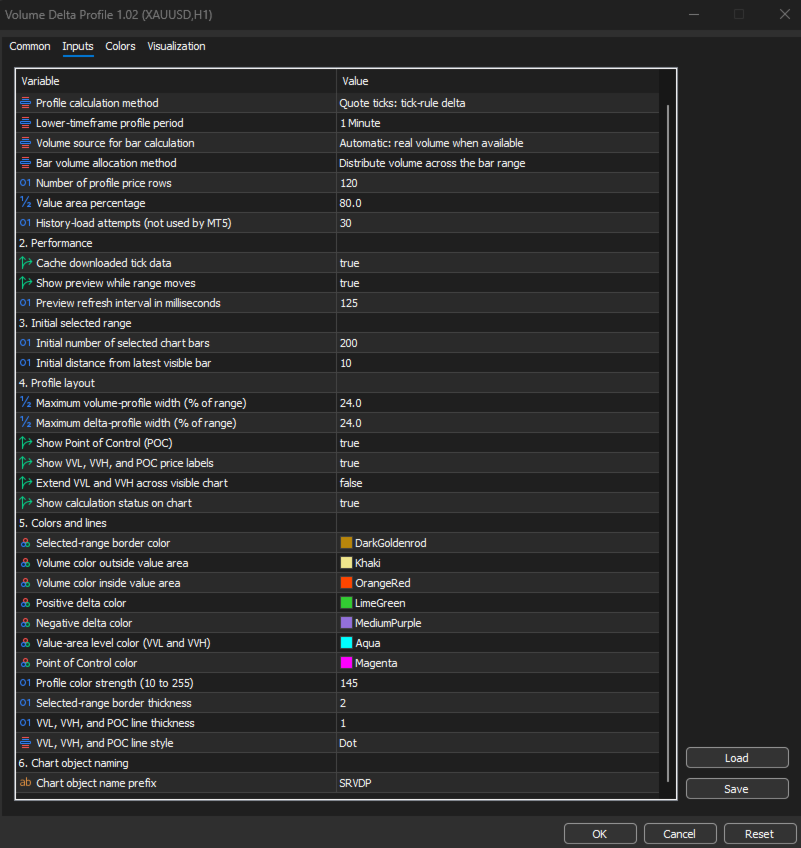
- Profile calculation method: Selects quote-tick calculation or lower-timeframe bar calculation.
- Lower-timeframe profile period: Sets the bar timeframe used by the lower-timeframe calculation method.
- Volume source: Selects automatic, tick, or real volume for bar-based profiles.
- Bar volume allocation method: Distributes each bar’s volume across its price range or assigns it to the typical or closing price
- Number of profile price rows: Controls the vertical resolution of the profile. More rows provide more detail.
- Value area percentage: Sets the percentage of total volume included between VVL and VVH.
Performance
- Cache downloaded tick data: Reuses tick history when the same range is calculated again.
- Show preview while range moves: Displays a faster preview while the selection rectangle is moved.
- Preview refresh interval: Controls how frequently the live preview is updated.
Initial Range
- Initial number of selected chart bars: Sets the width of the selection when the indicator starts.
- Initial distance from latest visible bar: Moves the initial selection away from the latest visible bar.
Profile Layout
- Maximum volume-profile width: Sets the maximum width of the volume histogram.
- Maximum delta-profile width: Sets the maximum width of the delta histogram.
- Show Point of Control: Shows or hides the highest-volume price level.
- Show price labels: Shows or hides the VVL, VVH, and POC labels.
- Extend levels across visible chart: Extends VVL, VVH, and POC across the chart, with their labels placed at the left edge.
- Show calculation status: Shows the selected period, data source, value area, and history status.
Colors and Lines
- Separate colors can be selected for the range border, volume inside and outside the value area, positive and negative delta, VVL/VVH, and POC.
- Profile color strength: Controls the visual strength of the profile colors.
- Range border thickness: Controls the thickness of the selection rectangle.
- Level thickness and style: Control the appearance of the VVL, VVH, and POC lines.
Chart Object Naming
-
Chart object name prefix: Sets the prefix used for objects created by the indicator. Use a different prefix for each indicator instance.