Breakout Scanner Pro
- Indicateurs
- Version: 1.0
- Activations: 20

Breakout Scanner Indicator: The Ultimate 4-Candle Harami Breakout Detection System
The Market Never Sleeps—But Now Your Scanning Does
Imagine having a tireless assistant that watches every single symbol in your Market Watch, across multiple timeframes simultaneously, scanning for one of the most powerful reversal patterns in technical analysis—and delivering the results to you in a clean, actionable dashboard before you've even finished your morning coffee.
That's exactly what the Breakout Scanner Indicator delivers.
This isn't just another chart overlay. This is a complete trading intelligence system that combines four proven market analysis techniques into one cohesive, battle-tested tool that professional traders rely on to spot high-probability setups before they happen.
---
What Makes This Indicator Different?
Most indicators show you what already happened. The Breakout Scanner shows you what's about to happen.
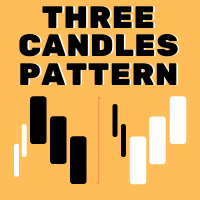
The 4-Candle Harami Breakout pattern is a sophisticated continuation/reversal setup that catches the exact moment when institutional money steps in to break a tight consolidation range. It's the pattern that precedes some of the most explosive moves in the market—and now you can scan for it across your entire portfolio with a single click.
The Pattern That Professional Traders Guard Closely
The Harami Breakout pattern works because it captures a very specific market psychology:
Candle 1 establishes the range—the battlefield where bulls and bears first clash.
Candle 2 opens and closes entirely inside Candle 1's range—the first sign of indecision and consolidation.
Candle 3 does the same inside Candle 2's range—a tightening coil, the calm before the storm.
Candle 4 opens inside the combined range but breaks decisively above or below Candle 1's extreme—the moment of truth, the breakout that signals a new trend direction.
This four-candle structure represents the final stages of accumulation or distribution before a significant move. When you see this pattern, you're witnessing the last opportunity to enter before price moves sharply in one direction.
---
Your New Trading Workflow: Scan, Identify, Execute
1. One Click Scans Your Entire Universe
Forget manually flipping through charts. The "SCAN MARKET" button in the top-left corner initiates a comprehensive scan across every enabled timeframe (M5 through D1) for every symbol in your Market Watch. In seconds, you'll know exactly which pairs are setting up for breakout moves.
2. The Dashboard—Your Command Center
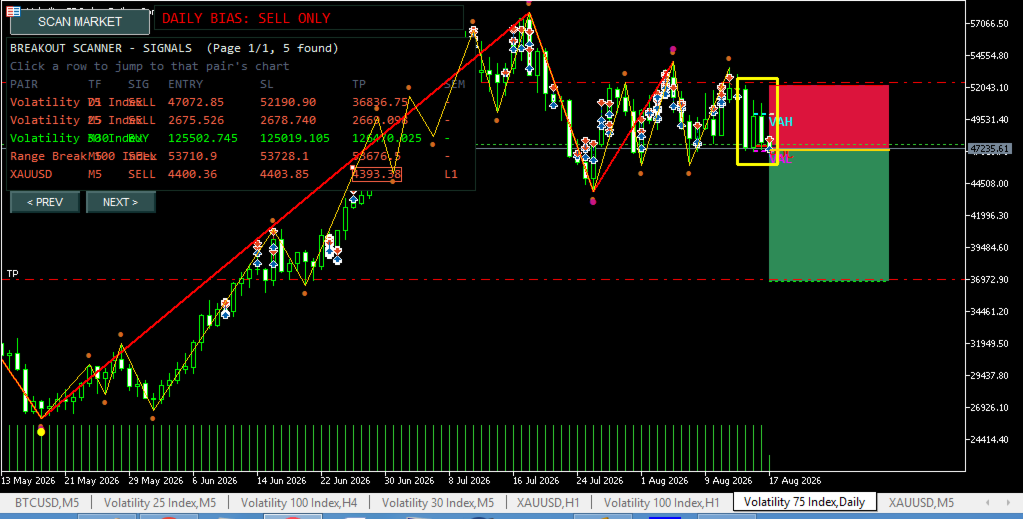
Results are presented in a wide, organized dashboard showing seven crucial data points for every signal:
PAIR – Which symbol is setting up
TF – The timeframe where the pattern emerged
SIG – BUY or SELL signal
ENTRY – The exact price to enter the trade
SL – Your stop-loss level, calculated mathematically
TP – Your profit target, offering a favorable risk-reward ratio
SEM – The Semafor level (L1/L2/L3) confirming the setup
3. Jump Directly to Any Signal
Click any row in the dashboard, and the indicator instantly opens that pair's chart on the correct timeframe, automatically attaches itself, and draws the exact pattern with your entry, stop-loss, and profit target clearly marked. No searching. No guessing. Just pure execution.
---
Professional-Grade Features That Serious Traders Demand
The 3-Level Semafor System
The Semafor component is your confidence filter. When a Harami Breakout pattern aligns with a Semafor pivot point, you're looking at a confluence of two independent analytical systems pointing to the same conclusion. This dramatically improves your win rate by filtering out weaker setups.
Three independent ZigZag levels (L1 with true fractal or classic ZigZag, L2, and L3) identify key reversal points in price action. If your breakout pattern's first candle coincides with one of these pivot levels, the dashboard tags it with the corresponding level number—instant visual confirmation that institutional players are likely involved.
Daily Volume Profile with POC, VAH, and VAL
Volume doesn't lie. The Daily Volume Profile component draws the Point of Control (POC), Value Area High (VAH), and Value Area Low (VAL) for each trading day. These levels represent where the most trading activity occurred and serve as magnetic price zones that attract price.
When your breakout signal occurs near these volume nodes, you have an additional layer of confirmation. A breakout from a value area low to the upside, or from value area high to the downside, carries significantly more weight than a breakout occurring in an area of low volume.
Daily Bias Composite Indicator
The market has a trend. The Daily Bias indicator tells you what it is.
Combining EMA, RSI, MACD, and ADX on the daily timeframe, this composite indicator displays a clear color-coded label at the top of your chart:
GREEN – "DAILY BIAS: BUY ONLY" – The daily trend strongly supports long positions
RED – "DAILY BIAS: SELL ONLY" – The daily trend strongly supports short positions
YELLOW – "DAILY BIAS: NO CLEAR BIAS" – Exercise caution and consider higher timeframe confirmation
This feature prevents you from fighting the larger trend and helps you align your trades with institutional flow.
Standalone ZigZag and ZigZag-Fractal Lines
Sometimes you need to see the underlying structure of price action. The standalone ZigZag and ZigZag-Fractal lines overlay the chart with clear, color-coded trend lines showing you the path of least resistance. These aren't just visual aids—they're used internally for the Semafor tagging system, ensuring that every signal has a meaningful connection to price structure.
---
Visual Clarity That Improves Decision Making
Yellow Highlight Box
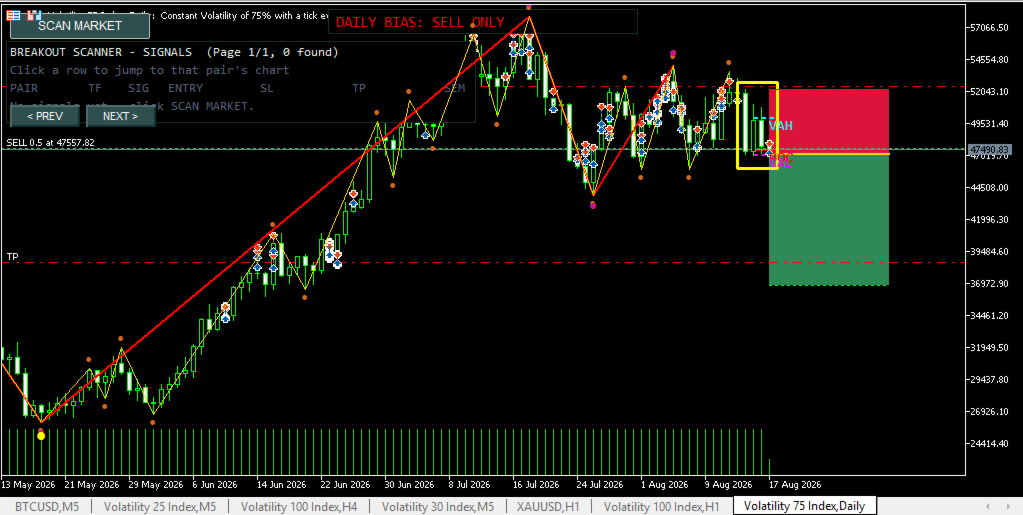
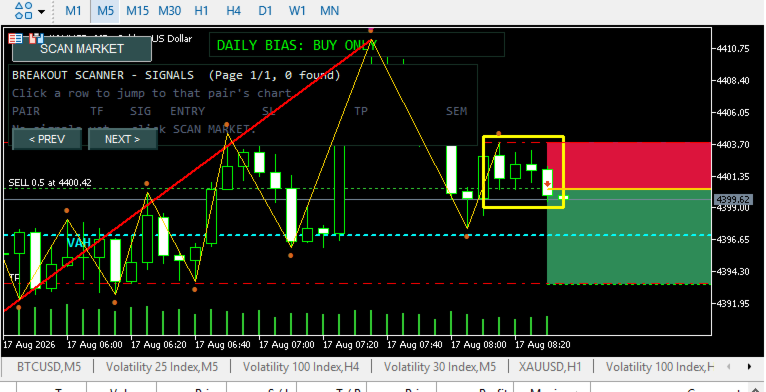
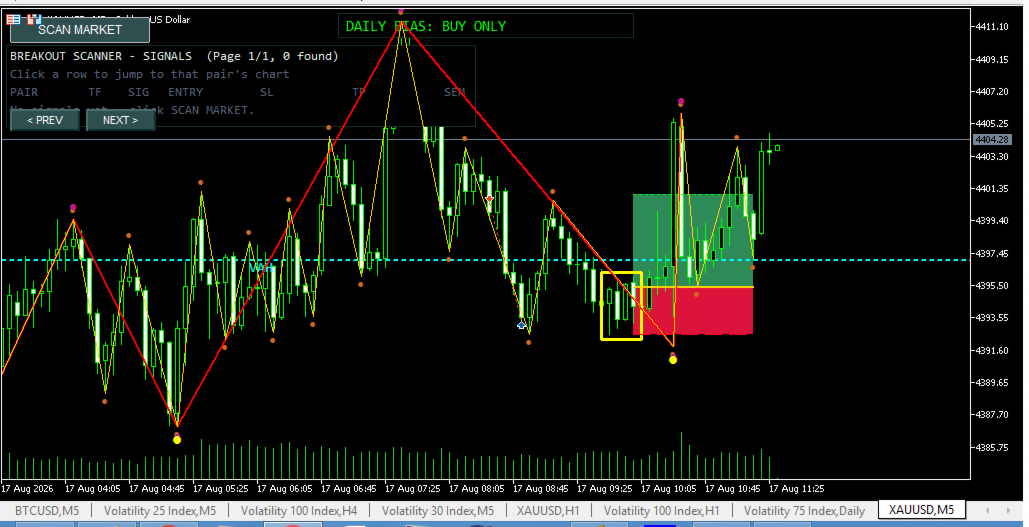
The four candles that form the Harami pattern are framed with a yellow outline box. This instantly shows you exactly which candles triggered the signal, so you can visually verify the pattern's validity.
Entry → SL and Entry → TP Boxes
Your risk and reward parameters are drawn directly on the chart as semi-transparent boxes:
RED box – From entry to stop-loss, showing your potential loss
GREEN box – From entry to profit target, showing your potential gain
These boxes extend to the right, projecting your trade parameters into the future so you can see at a glance where your risk and reward lie relative to current price.
Gold Entry Line, Red SL Line, Green TP Line
For precise reference, the entry level is drawn as a gold solid line, your stop-loss as a red dashed line, and your profit target as a green dotted line. This visual system makes trade management intuitive and effortless.
---
The Technology Behind the Scenes
Smart Signal Persistence
When you scan the market, the indicator saves the exact parameters of every signal it finds. Click any signal row, and the indicator opens the appropriate chart and redraws that exact pattern—even if that pattern is no longer visible on the current live chart. This is crucial because it allows you to review and act on signals that may have been generated hours or even days ago.
Global Variable Communication
The indicator uses terminal global variables to pass signal data between charts. This sophisticated approach ensures that when you jump to a signal, the target chart receives the exact pattern parameters and can immediately render the highlight, entry, SL, and TP boxes without re-scanning.
Automatic Indicator Attachment
When you jump to a signal on a chart that doesn't currently have the Breakout Scanner running, the indicator attempts to automatically attach itself. You never need to manually drag the indicator onto the chart—the system handles this for you.
Page Navigation for Unlimited Signals
The dashboard displays up to five signals per page, with PREV and NEXT buttons for easy navigation. Whether you find three signals or thirty, you can browse through them all quickly and efficiently.
---
Configuration That Adapts to Your Trading Style
Flexible Timeframe Selection
Enable or disable any combination of M5, M15, M30, H1, H4, and D1 timeframes. Scan only the timeframes that matter to your trading style.
Customizable Pattern Parameters
Adjust the highlight, SL, and TP box colors to match your visual preferences. Set how far the entry/SL/TP boxes extend to the right. Fine-tune the Semafor lookback period for tagging.
Daily Bias Customization
Configure the EMA period, RSI period, MACD parameters, and ADX threshold to align with your preferred trend detection methodology.
Chart Cosmetics
Enable the built-in chart cosmetics to remove grid lines and add period separators on timeframes below H4—making your charts cleaner and easier to read.
---
Who Is This Indicator For?
Scalpers and Day Traders
The M5 and M15 scans catch intraday breakout setups in fast-moving markets. The yellow highlight and entry/SL/TP boxes appear in real-time on your charts, allowing you to act quickly on emerging opportunities.
Swing Traders
The H1, H4, and D1 scans identify higher timeframe setups that can yield substantial moves over several days or weeks. The Daily Bias indicator ensures you're trading in the direction of the larger trend.
Portfolio Managers
Scanning the entire Market Watch across multiple timeframes gives you a complete picture of where opportunities exist across your entire portfolio. No more flipping between dozens of charts trying to find setups.
Forex, Indices, and Commodities Traders
The indicator works with any symbol that has sufficient historical data. Whether you trade major forex pairs, exotic crosses, stock indices, or commodities, the Breakout Scanner has you covered.
---
What the Source Code Reveals About Its Quality
This isn't a slapped-together indicator with questionable logic. The codebase demonstrates professional-grade programming with:
· Proper buffer management with INDICATOR_CALCULATIONS
· Efficient scan algorithms that process large datasets quickly
· Smart error handling that prevents indicator crashes
· Graceful degradation when data is unavailable
· Clean object management that prevents chart clutter
· Thread-safe global variable access for cross-chart communication
The volume profile computation uses proper tick volume distribution across the value area, not simplistic price-based calculations. The ZigZag and fractal scanning follows the correct algorithmic approach with backstep and deviation controls.
---
Common Questions from Professional Traders
Q: How fast is the full market scan?
A: A complete scan of your entire Market Watch across all enabled timeframes typically completes in seconds. The indicator uses efficient copying and processing of price data to minimize latency.
Q: Can I run this on multiple charts simultaneously?
A: Yes. The indicator uses unique object prefixes for each instance, so multiple charts can run the indicator without interfering with each other.
Q: Does it repaint or recalculate historical signals?
A: The 4-candle Harami detection uses fixed candle data, so signals are stable once formed. The Semafor levels may adjust slightly as new ZigZag points are identified, but the dashboard signals are preserved when you scan.
Q: How reliable is the pattern detection?
A: The Harami Breakout is a well-documented technical pattern with a strong statistical edge. Combined with Semafor validation and the Daily Bias filter, you're trading with multiple layers of confirmation.
Q: Can I use this on cryptocurrencies?
A: Absolutely. The indicator works with any symbol that has historical price data available, including crypto pairs, provided they're in your Market Watch.
---
The Bottom Line: Why You Need This Indicator Today
Trading is about finding edges and acting on them faster than the crowd. The Breakout Scanner gives you both.
The Edge: The 4-Candle Harami Breakout pattern, validated by Semafor levels, Volume Profile, and Daily Bias, identifies high-probability setups that most traders miss.
The Speed: One-click scanning across your entire portfolio, a clear dashboard with all critical information, and instant chart jumping with your trade parameters already marked.
The Confidence: Multiple independent analytical systems converging on the same signal means you're not gambling—you're trading with conviction.
The Result: More time analyzing, less time searching. More confidence in your entries, less hesitation. More winning trades, fewer missed opportunities.
---
Join the Traders Who've Made the Breakout Scanner Part of Their Daily Routine
The Breakout Scanner isn't just an indicator—it's a complete trading workflow that transforms how you approach the markets. From the moment you install it, you'll wonder how you ever traded without it.
Stop manually scanning charts. Stop missing setups while you're flipping between timeframes. Stop entering trades without complete confirmation.
The Breakout Scanner is your 24/7 market intelligence officer, scanning, identifying, and presenting opportunities in a format that allows you to act with speed and precision.
Install it today. Scan the market. Take the trades that matter.
---
Technical Specifications
· Format: MQL5 compiled indicator (.ex5)
· Platform: MetaTrader 5
· Charts: Any timeframe, any symbol
· Scan Scope: Market Watch symbols across M5, M15, M30, H1, H4, D1
· Dashboard: Interactive with click-to-jump functionality
· Memory Footprint: Lightweight with minimal CPU usage
· Semafor Levels: 3-level with independent parameter control
· Volume Profile: Daily POC/VAH/VAL with configurable value area percentage
· Daily Bias: Composite indicator across four independent measures
· Visual Components: Yellow highlight, Entry/SL/TP boxes, Semafor arrows, ZigZag lines
---
The Breakout Scanner Indicator is your unfair advantage in the markets. Built for serious traders, designed for professional results. Make it yours and transform your trading immediately.