ZCompass

The Z-Compass is part of a suite of four indicators called the Z-Tools Black you can buy separately in the MetaTrader Market.

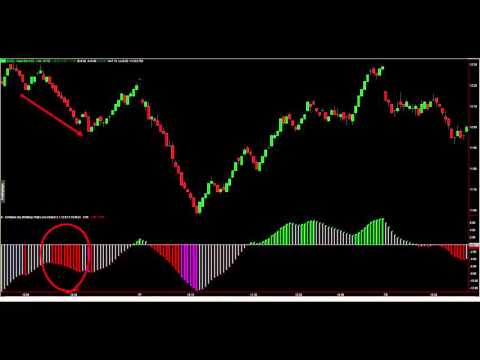
The Z-Compass is one of the most important indicators, because it serves as a compass in the market and is composed of the following elements

A histogram and zero line.

  • The histogram is plotted with each candle and changes depending on the selected time frame.
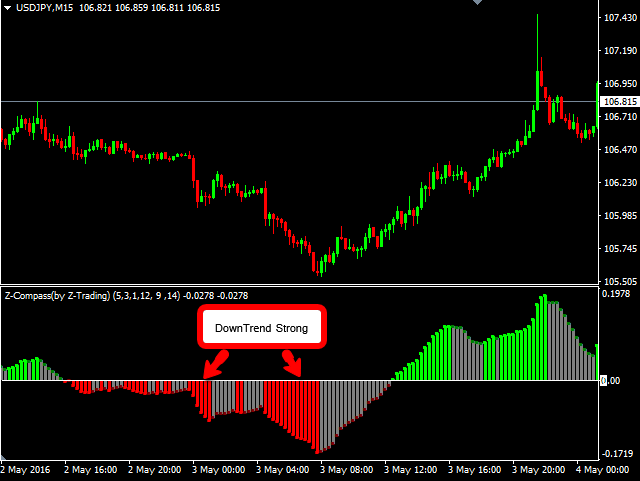
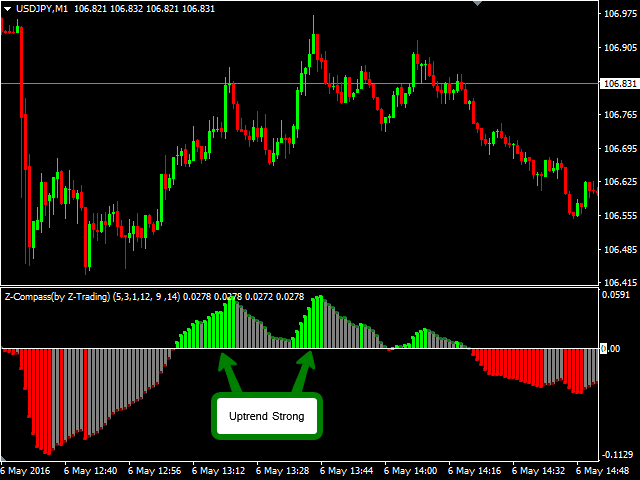
  • When the histogram is above the zero line, we say the trend or momentum is bullish and when it is below the zero line the trend or momentum is bearish.
  • When in the histogram appears green bars, indicates us that the upward movement has strength, therefore keep longs and avoid taking short positions.
  • When in the histogram appears red bars, indicates us that the downward movement has strength, therefore we maintain short positions, and avoid taking longs.
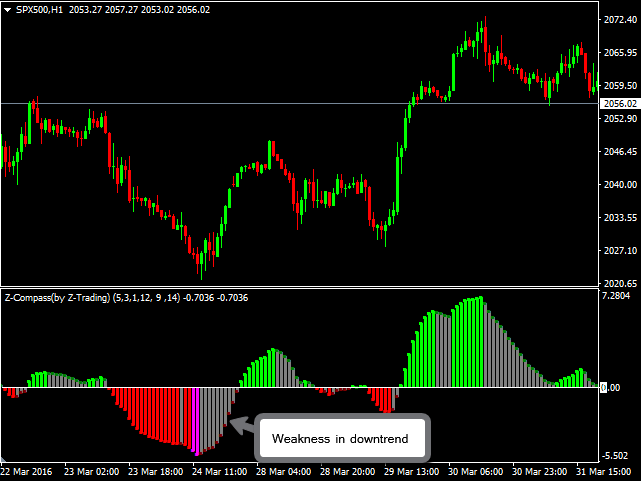
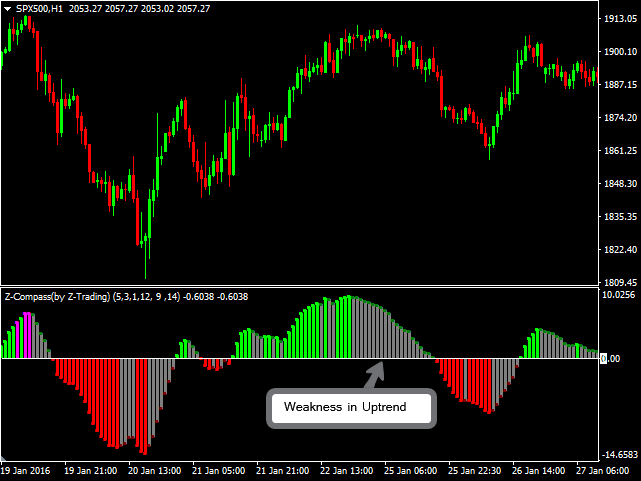
  • When in the histogram appears gray bars, indicates us that the movement is losing strength, if It is attached by a dark green dot refers to weakness in the bullish momentum and if it is a dark red dot refers to weakness in the bearish momentum.
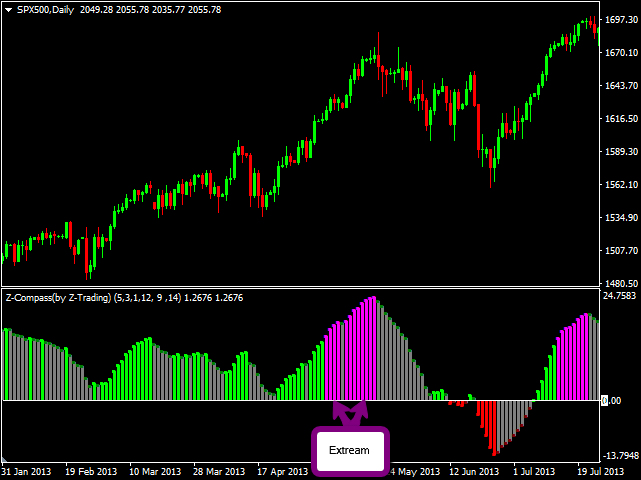
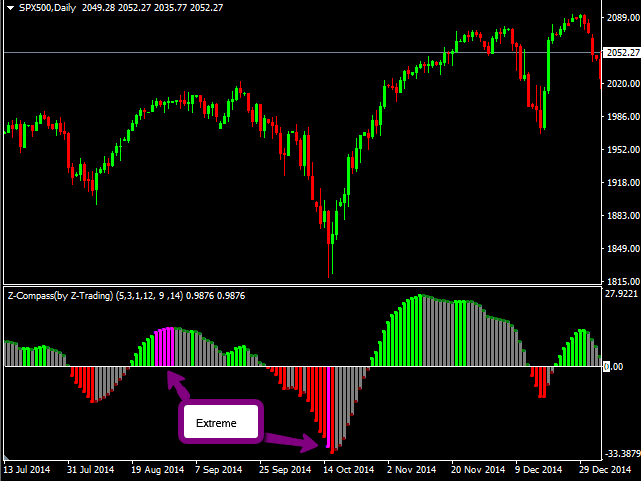
  • Magenta color bars means that the bearish or bullish movement is extended. Not for this we must understand that the momentum has ended, but it is a sign that will have difficulty to maintain.
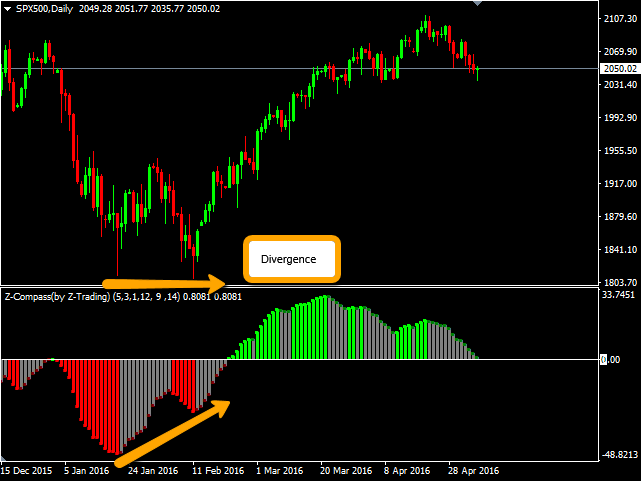
  • Look for divergences: For instance where prices are making a series of new Lowest and the Z-Compass is failing to surpass its previous lowest.


Indicator Parameters

  • ZLength1 = This is the number of time periods used when calculating a moving average of SlowK and SlowD. By default is 5.
  • ZLength2 = This value controls the internal smoothing of SlowK and SlowD. A value of 1 is considered a fast stochastic; a value of 3 is considered a slow stochastic. By default is 3.
  • CompassFL = The Exponential Moving Average. By default is 12.
  • CompassLength = The Exponential Moving Average for calculating of histogram. By default is 9.
  • CompassXD = This is the number of time periods used when calculating of extreme movement. By default is 14.
  • ZStochLength = This is the number of time periods used when calculating of histogram. By default is 14.
  • CompasSL = The Exponential Moving Average for calculating of histogram. By default is 26.

Know all indicators Z-Tools Black suit composed of four indicators which together deliver a professional reading of the market, so we invite you to also:

  • ZBeatZone
  • ZZone
  • ZTrend
Produits recommandés
The new update makes this indicator a complete tool for studying, analyzing and operating probabilistic patterns. It includes: On-chart Multi-asset percentage monitor. Configurable martingales. Twenty-one pre-configured patterns , including Mhi patterns and C3. An advanced pattern editor to store up to 5 custom patterns. Backtest mode to test results with loss reports. Trend filter. Hit operational filter. Martingale Cycles option. Various types of strategies and alerts. Confluence between patte
L'indicateur construit les cotations actuelles, qui peuvent être comparées aux cotations historiques et, sur cette base, faire une prévision de l'évolution des prix. L'indicateur dispose d'un champ de texte pour une navigation rapide jusqu'à la date souhaitée. Option : Symbole - sélection du symbole que l'indicateur affichera ; SymbolPeriod - sélection de la période à partir de laquelle l'indicateur prendra des données ; IndicatorColor - couleur de l'indicateur ; HorisontalShift - décalage
Blahtech Market Profile
Blahtech Limited
4.53 (15)
Was: $249  Now: $99   Market Profile defines a number of day types that can help the trader to determine market behaviour. A key feature is the Value Area, representing the range of price action where 70% of trading took place. Understanding the Value Area can give traders valuable insight into market direction and establish the higher odds trade. It is an excellent addition to any system you may be using. Blahtech Limited presents their Market Profile indicator for the MetaTrader community. Ins
Indicateur de gestion du risque et de suivi des limites pour traders professionnels et comptes d’évaluation (Prop) Cet outil affiche uniquement sur le graphique des informations précises de gestion du risque et de limites afin de vous aider à décider avec plus de concentration. L’indicateur n’ouvre/ferme/modifie aucune position et n’interfère pas avec les Expert Advisors. Fonctionnalités Suivi du drawdown quotidien et total Calcule et affiche le drawdown quotidien et total sur la base du solde
We present you the indicator "Candle closing counter", which will become your indispensable assistant in the world of trading. That’s why knowing when the candle will close can help: If you like to trade using candle patterns, you will know when the candle will be closed. This indicator will allow you to check if a known pattern has formed and if there is a possibility of trading. The indicator will help you to prepare for market opening and market closure. You can set a timer to create a pre
AW Candle Patterns MT4
AW Trading Software Limited
L'indicateur AW Candle Patterns est une combinaison d'un indicateur de tendance avancé combiné à un puissant scanner de modèles de bougies. C'est un outil utile pour reconnaître et mettre en évidence les trente modèles de chandeliers les plus fiables. De plus, c'est un analyseur de tendance actuel basé sur des barres colorées avec un       panneau de tendance multi-période plug-in qui peut être redimensionné et positionné. Une possibilité unique d'ajuster l'affichage des motifs en fonction du fi
Volume Compair
Thiago Pereira Pinho
Professional Cumulative Delta & Volume Median Indicator Track   real buying/selling pressure   with this powerful volume analysis tool. The   Volume Compare Indicator   combines   Cumulative Delta   and   Volume Medians   to help you identify institutional activity, imbalances, and potential reversals. Key Features: Cumulative Delta Histogram   – Visualizes net buying vs. selling volume in real-time. Buy/Sell Volume Medians   – Horizontal lines showing average buy & sell volume levels. Smart Vo
ZZone
Sergio Andres Zuleta Lopez
The Z-Zone is part of a suite of four indicators called the Z-Tools Black you can buy separately in the MetaTrader Market. The Z-Zone is based on the Market Profile and includes three dynamic lines: At the top is the resistance of zone (that we´ll identify as RoZ ) In the center we find the average distribution of the area (that we´ll identify as PoC ) At the bottom is the support of zone (that we´ll identify as SoZ ) Together they make up what we call the value zone, meaning that the market mo
Price Magnet — Price Density and Attraction Levels Indicator Price Magnet is a professional analytical tool designed to identify key support and resistance levels based on statistical Price Density. The indicator analyzes a specified historical period and detects price levels where the market spent the most time. These zones act as “magnets,” attracting price action or forming a structural base for potential reversals. Unlike traditional Volume Profile tools, Price Magnet focuses on price-time d
Un indicateur technique qui calcule ses lectures sur les volumes de transactions. Sous forme d'histogramme, il montre l'accumulation de la force de mouvement de l'instrument de trading. Il dispose de systèmes de calcul indépendants pour les directions haussières et baissières. Fonctionne sur tous les instruments de trading et délais. Peut compléter n’importe quel système commercial. L'indicateur ne redessine pas ses valeurs, les signaux apparaissent sur la bougie actuelle. Il est facile à utilis
L'indicateur SMC Venom Model BPR est un outil professionnel pour les traders travaillant dans le concept Smart Money (SMC). Il identifie automatiquement deux modèles clés sur le graphique des prix: FVG   (Fair Value Gap) est une combinaison de trois bougies, dans laquelle il y a un écart entre la première et la troisième bougie. Forme une zone entre les niveaux où il n'y a pas de support de volume, ce qui conduit souvent à une correction des prix. BPR   (Balanced Price Range) est une combinaiso
EZZ Zig Zag MT4
Paulo Rocha
5 (1)
EZZ Elite Zig Zag is an indicator for the MetaTrader 4 terminal. This indicator traces the peak of the trend based on the market reversal, thus showing various opportunities in the financial market. EZZ Elite Zig Zag is a visual tool, intuitive, and easy to understand and use.  Test it Yourself by Downloading it for Free. Author Paulo Rocha all rights reserved
Cosmic Diviner X Planet
Olena Kondratenko
4 (2)
This unique multi-currency strategy simultaneously determines the strength of trends and market entry points, visualizing this using histograms on the chart. The indicator is optimally adapted for trading on the timeframes М5, М15, М30, Н1. For the convenience of users, the indicator renders the entry point (in the form of an arrow), recommended take profit levels (TP1, TP2 with text labels) and the recommended Stop Loss level. The take profit levels (TP1, TP2) are automatically calculated for
Infinity Trend Pro
Yaroslav Varankin
1 (1)
This is a trend indicator without redrawing Developed instead of the binary options strategy (by the color of the Martingale candlestick) Also works well in forex trading When to open trades (binary options) A signal will appear in the place with a candle signaling the current candle It is recommended to open a deal for one candle of the current timeframe M1 and M5 When a blue dot appears, open a deal up When a red dot appears, open a trade down. How to open trades on Forex. When a signal is rec
Phase Analytics Pro: Advanced Cyclic Market Analyzer Phase Analytics Pro is a sophisticated technical tool designed for traders who prioritize mathematical precision over lag-heavy traditional indicators. Based on the principles of digital signal processing, this indicator decomposes price action into phase and quadrature components to identify the dominant market cycle. How it works: The algorithm calculates the instantaneous phase of the market, allowing it to distinguish between trending and
BoxChart MT4
Evgeny Shevtsov
4.4 (5)
The market is unfair if only because 10% of participants manage 90% of funds. An ordinary trader has slim changes to stand against these "vultures". This problem can be solved. You just need to be among these 10%, learn to predict their intentions and move with them. Volume is the only preemptive factor that faultlessly works on any timeframe and symbol. First, the volume appears and is accumulated, and only then the price moves. The price moves from one volume to another. Areas of volume accumu
Trend Bilio - an arrow indicator without redrawing shows potential market entry points in the form of arrows of the corresponding color: upward red arrows suggest opening a buy, green down arrows - selling. The entrance is supposed to be at the next bar after the pointer. The arrow indicator Trend Bilio visually "unloads" the price chart and saves time for analysis: no signal - no deal, if an opposite signal appears, then the current deal should be closed. It is Trend Bilio that is considered
Divergence Osw Metatrader 4
William Oswaldo Mayorga Urduy
DIVERGENCE OSW  (For Metatrader 4) This indicator works on divergences and has the following functions: Generate an alert when a divergence occurs. Create lines by calculating the Stoploss and Takeprofit according to projection waves of inverse waves. Create an arrow indicating the possible direction of the market. The signals sent by the indicator are given when the candle ends. The Trader must evaluate each divergence to take entries. Settings: Activation and deactivation of alerts. Alert inte
The indicator allows you to trade binary options. The recommended time frame is М1 and the expiration time is 1,2,3 minutes. The indicator suitable for auto and manual trading. A possible signal is specified as a arrows above/under a candle. You should wait until the candle closes! Arrows are not re-painted Trade sessions: TOKYO section (Half-end) Currency pairs: USD/JPY Working time frame: M1 Expiration time: 1,2,3 minutes. The indicator also shows good results when using the martingale strateg
FREE
Mirror
Stanislav Korotky
This indicator predicts rate changes based on the chart display principle. It uses the idea that the price fluctuations consist of "action" and "reaction" phases, and the "reaction" is comparable and similar to the "action", so mirroring can be used to predict it. The indicator has three parameters: predict - the number of bars for prediction (24 by default); depth - the number of past bars that will be used as mirror points; for all depth mirroring points an MA is calculated and drawn on the ch
Super Reversal Pattern
Parfait Mujinga Ndalika
Super Reversal Pattern Indicator Unlock the power of advanced pattern recognition with our Super Reversal Pattern Indicator. Designed for traders seeking precision and reliability, this indicator identifies one of the most effective reversal patterns in technical analysis, offering a significant edge in your trading strategy. Key Features: Non-Repainting Accuracy: Enjoy the confidence of non-repainting technology. Once a Super Reversal Pattern is detected, it remains static, providing consiste
How TrendMaster Works TrendMaster is a trading indicator designed to streamline and enhance your chart analysis. Using algorithmic logic, it reviews historical price data to generate a dynamic reference line. When price action crosses this line, a "BUY" or "SELL" signal is displayed on your chart. The goal is to assist in identifying potential shifts in price behavior with a clear and user-friendly visual approach. Why Use TrendMaster? The TrendMaster MT4 Indicator helps highlight potential tre
Night ghost
Dmitriy Kashevich
Night Ghost - Indicateur de flèche pour les options binaires. Ceci est un assistant fiable pour vous à l'avenir! - Pas de redessin sur le graphique -Fonctionne très bien sur toutes les paires de devises ! -Précision de l'indicateur jusqu'à 90% (surtout la nuit) -Pas besoin de configurer pendant une longue période (configurer parfaitement pour les options binaires) - Pas de signaux en retard - L'apparition d'un signal sur la bougie en cours -Parfait pour la période M1 (Pas Plus !) - Cou
The Volume Impuls VSA indicator paints a histogram of volumes tading into account the bar direction and comparing it with the volume of previous bars. The volume of the rising and falling trend are painted respectively in blue and in red. If the current volume exceeds the volumes of the opposite direction, an impulse is formed. Accordingly, the impulse of the upward and downward trends are painted in blue and orange. Also the indicator displays three levels, based on which you can easily compare
A top-quality implementation of the famous  Zig Zag  indicator, which needs no introduction. It is completely coming from original algorithm.  After you have this indicator, you will no need any more indicator for opposite direction of trend. Trading direction of TREND Very easy to understand and set  It implements a multi-timeframe dashboard Buy and Sell signals on same chart  Working M5-M15-M30-H1-H4 and D1  After the purchase, please contact me for to learn how to use it. 
Alpha Trend sign est notre outil de Trading très populaire depuis longtemps, il valide notre système de Trading et invite clairement les signaux de Trading sans dérive. Fonctions principales: • En fonction de la zone active du marché, selon les indicateurs, il est intuitif de déterminer si le cours actuel appartient à la tendance ou à la tendance. Et coupez le marché selon les flèches d'indication de l'indicateur, les flèches vertes suggèrent d'acheter et les flèches rouges suggèrent de vend
Forex Gump
Andrey Kozak
2.4 (5)
Forex Gump is a fully finished semi-automatic trading system. In the form of arrows, signals are displayed on the screen for opening and closing deals. All you need is to follow the instructions of the indicator. When the indicator shows a blue arrow, you need to open a buy order. When the indicator shows a red arrow, you need to open a sell order. Close orders when the indicator draws a yellow cross. In order to get the most effective result, we recommend using the timeframes H1, H4, D1. There
Индикатор присваивает каждой свече уникальный код, который зависит от ее параметров - направления, размеров верхней и нижней тени и размера тела. Алгоритм расчета кода свечи следующий: строится семизначный двоичный код, первое место в котором обозначает направление свечи, 2-е и 3-е места - размер тела, 3-е и 4-е - размер верхней тени, 5-е и 6-е - размер нижней тени (см. скриншот 7). На эти позиции ставится 0 или 1 в зависимости от параметров свечи: Направление свечи (цвет тела) 1 – бычья свеча
EARLY REMINDER: The Starting price is 65 price will rise soon up to 365$ and then 750$ after first 10 copies of sales. Grab this offer now! Introduction Hello, traders! Welcome to the demonstration of the Forex Beast Indicator , a comprehensive tool designed to assist aspiring traders in navigating the complexities of the forex market. This indicator incorporates seven essential components to provide a well-rounded trading experience: Moving Averages Colored Zones Support and Resistance Levels
Description The Market Profile & Volume Profile Indicator is a powerful technical analysis tool designed to visualize market activity and price distribution over specific timeframes. Unlike standard technical indicators that focus solely on price over time, this indicator organizes price data to show where the market spent the most time (TPO) and where the most volume was traded (Volume Profile). It automatically calculates and displays key structural levels such as the Point of Control (POC) ,
Les acheteurs de ce produit ont également acheté
Gann Made Easy
Oleg Rodin
4.83 (160)
Gann Made Easy est un système de trading Forex professionnel et facile à utiliser qui est basé sur les meilleurs principes de trading en utilisant la théorie de mr. WD Gann. L'indicateur fournit des signaux d'ACHAT et de VENTE précis, y compris les niveaux Stop Loss et Take Profit. Vous pouvez échanger même en déplacement en utilisant les notifications PUSH. VEUILLEZ ME CONTACTER APRÈS L'ACHAT POUR RECEVOIR GRATUITEMENT DES INSTRUCTIONS DE TRADING ET D'EXCELLENTS INDICATEURS SUPPLÉMENTAIRES! Vou
M1 Sniper
Oleg Rodin
5 (21)
M1 SNIPER est un système d'indicateurs de trading facile à utiliser. Il s'agit d'un indicateur à flèche conçu pour l'unité de temps M1. Cet indicateur peut être utilisé seul pour le scalping sur l'unité de temps M1 ou intégré à votre système de trading existant. Bien que conçu spécifiquement pour le trading sur l'unité de temps M1, ce système peut également être utilisé avec d'autres unités de temps. Initialement, j'avais conçu cette méthode pour le trading du XAUUSD et du BTCUSD. Cependant, je
Scalper Inside PRO
Alexey Minkov
4.74 (69)
Scalper Inside PRO – Since 2020. An exclusive indicator that utilizes an innovative algorithm to swiftly and accurately determine the market trend. The indicator automatically calculates opening, closing, and profit levels, providing detailed trading statistics. With these features, you can choose the most appropriate trading instrument for the current market conditions. Additionally, you can easily integrate your own arrow indicators into Scalper Inside Pro to quickly evaluate their statistics
Ultimate Sniper Dashboard
Hispraise Chinedum Abraham
4.82 (22)
Prix réduit à 299 $ ! Les prix peuvent augmenter à l'avenir ! Lisez la description ci-dessous ! Meilleur système d'entrée pour le tableau de bord Ultimate Sniper : NIVEAUX DYNAMIQUES ULTIMES. (Veuillez consulter mes produits) L'Ultimate Sniper Dashboard fonctionne UNIQUEMENT sur les marchés en direct en raison des limites des tests multidevises de MT4. Voici l'Ultimate-Sniper Dashboard ! Notre meilleur produit qui contient à la fois HA-Sniper, MA-Sniper et de nombreux modes spéciaux. L'Ultima
Market Makers
Mohamed Hassan
5 (3)
After purchase, contact me privately to receive 1 month of free testing with EA Forex Proton! This advanced MT4 trading robot automatically executes signals from any MT4 indicator, including Market Makers. The latest version also includes AI integration, allowing each trade signal to be analyzed using Artificial Intelligence. Live Signal with EA Forex Proton: Click here Market Makers is a powerful price action trading system designed to identify high-probability Buy and Sell opportunities based
Trend Screener
STE S.S.COMPANY
4.79 (95)
Indicateur de tendance, solution unique révolutionnaire pour le trading et le filtrage des tendances avec toutes les fonctionnalités de tendance importantes intégrées dans un seul outil ! Il s'agit d'un indicateur multi-période et multi-devises 100 % non repeint qui peut être utilisé sur tous les symboles/instruments : forex, matières premières, crypto-monnaies, indices et actions. OFFRE À DURÉE LIMITÉE : L'indicateur Support and Resistance Screener est disponible pour seulement 50 $ et à vie. (
Atomic Analyst
Issam Kassas
5 (5)
Tout d'abord, il convient de souligner que cet indicateur de trading n'est ni repainting, ni redrawing et ne présente aucun délai, ce qui le rend idéal à la fois pour le trading manuel et automatisé. Manuel de l'utilisateur : réglages, entrées et stratégie. L'Analyste Atomique est un indicateur d'action sur les prix PA qui utilise la force et le momentum du prix pour trouver un meilleur avantage sur le marché. Équipé de filtres avancés qui aident à éliminer les bruits et les faux signaux, et à
Super Signal – Skyblade Edition Système de signaux de tendance professionnel sans repaint / sans latence, avec un taux de réussite exceptionnel | Pour MT4 / MT5 Il fonctionne mieux sur des unités de temps inférieures, comme 1 minute, 5 minutes et 15 minutes. Caractéristiques principales : Super Signal – Skyblade Edition est un système de signaux intelligent conçu spécifiquement pour le trading de tendance. Il utilise une logique de filtrage multicouche pour détecter uniquement les mouvements d
Nous vous présentons ON Trade Waves Patterns Harmonic Elliot Wolfe, un indicateur avancé conçu pour détecter divers types de schémas sur le marché à l'aide de méthodes manuelles et automatiques. Voici comment il fonctionne : Schémas Harmoniques : Cet indicateur peut identifier les schémas harmoniques qui apparaissent sur votre graphique. Ces schémas sont essentiels pour les traders qui pratiquent la théorie du trading harmonique, telle qu'elle est décrite dans le livre de Scott Carney "Harmonic
L'indicateur « Dynamic Scalper System » est conçu pour la méthode de scalping, permettant de trader au sein des vagues de tendance. Testé sur les principales paires de devises et l'or, il est compatible avec d'autres instruments de trading. Fournit des signaux pour l'ouverture de positions à court terme le long de la tendance, avec un support supplémentaire pour les fluctuations de prix. Principe de l'indicateur : De grandes flèches déterminent la direction de la tendance. Un algorithme de gén
Le système PRO Renko est un système de trading très précis spécialement conçu pour le trading de graphiques RENKO. Il s'agit d'un système universel qui peut être appliqué à divers instruments de négociation. Le système neutralise efficacement ce qu'on appelle le bruit du marché en vous donnant accès à des signaux d'inversion précis. L'indicateur est très facile à utiliser et n'a qu'un seul paramètre responsable de la génération du signal. Vous pouvez facilement adapter l'outil à n'importe que
TPSpro RFI Levels
Roman Podpora
4.86 (28)
INSTRUCTIONS RUS  /  INSTRUCTIONS   ENG  /  Version MT5 Fonctions principales : Affiche les zones actives des vendeurs et des acheteurs ! L'indicateur affiche tous les niveaux/zones de première impulsion corrects pour les achats et les ventes. Lorsque ces niveaux/zones sont activés, là où commence la recherche de points d'entrée, ils changent de couleur et se remplissent de certaines couleurs. Des flèches apparaissent également pour une perception plus intuitive de la situation. LOGIC AI - Affi
BTMM State Engine Pro is a MetaTrader 4 indicator for traders who use the Beat The Market Maker approach: Asian session context, kill zone timing, level progression, peak formation detection, and a multi-pair scanner from a single chart. It combines cycle state logic with a built-in scanner dashboard so you do not need the same tool on many charts at once. What it does Draws the Asian session range; session times can follow broker server offset or be set in inputs. Tracks level progression (L
Linear Trend Predictor - Un indicateur de tendance qui combine des points d'entrée et des lignes de support de direction. Fonctionne sur le principe de franchissement du canal des prix haut/bas. L'algorithme de l'indicateur filtre le bruit du marché, prend en compte la volatilité et la dynamique du marché. Capacités de l'indicateur  À l'aide de méthodes de lissage, il montre la tendance du marché et les points d'entrée pour l'ouverture d'ordres d'ACHAT ou de VENTE.  Convient pour déterminer l
ACTUELLEMENT 40% DE RÉDUCTION La meilleure solution pour tout débutant ou trader expert ! Cet indicateur est un outil de trading unique, de haute qualité et abordable car nous avons incorporé un certain nombre de caractéristiques exclusives et une nouvelle formule. Avec seulement UN graphique, vous pouvez lire la force de la devise pour 28 paires Forex ! Imaginez comment votre trading va s'améliorer parce que vous êtes capable de repérer le point de déclenchement exact d'une nouvelle tendance
Easy Breakout
Mohamed Hassan
4.71 (14)
After your purchase, feel free to contact me for more details on how to receive a bonus indicator called VFI, which pairs perfectly with Easy Breakout for enhanced confluence!    Easy Breakout is a powerful price action trading system built on one of the most popular and widely trusted strategies among traders: the Breakout strategy ! This indicator delivers crystal-clear Buy and Sell signals based on breakouts from key support and resistance zones. Unlike typical breakout indicators, it levera
Volatility Trend System - un système de trading qui donne des signaux pour les entrées. Le système de volatilité donne des signaux linéaires et ponctuels dans le sens de la tendance, ainsi que des signaux pour en sortir, sans redessiner ni retarder. L'indicateur de tendance surveille la direction de la tendance à moyen terme, montre la direction et son changement. L'indicateur de signal est basé sur les changements de volatilité et montre les entrées sur le marché. L'indicateur est équipé de pl
Trend Lines PRO
Roman Podpora
5 (1)
TREND LINES PRO     Cet indicateur permet de comprendre les véritables changements de direction du marché. Il révèle les renversements de tendance et les points de retour des principaux acteurs. Tu vois     Lignes BOS     Détection des changements de tendance et des niveaux clés sur des unités de temps supérieures, sans paramètres complexes ni interférences inutiles. Les signaux restent affichés sur le graphique même après la fermeture de la bougie. VERSION MT 5    -     Révèle son potentiel max
GOLD Impulse with Alert
Bernhard Schweigert
4.67 (12)
Cet indicateur est une super combinaison de nos 2 produits Advanced Currency IMPULSE with ALERT  +   Currency Strength Exotics . Il fonctionne pour tous les cadres temporels et montre graphiquement l'impulsion de force ou de faiblesse pour les 8 principales devises plus un symbole ! Cet indicateur est spécialisé pour montrer l'accélération de la force des devises pour tout symbole comme l'or, les paires exotiques, les matières premières, les indices ou les contrats à terme. C'est le premier
Order Block Hunter
Noha Mohamed Fathy Younes Badr
5 (10)
Order block hunter indicator is the best indicator for  hunt the order blocks that area where there has been a large concentration of limit orders waiting to be executed Order blocks are identified on a chart by observing previous price action and looking for areas where the price experienced significant movement or sudden changes in direction .This indicator does that for you by using very complicated codes and helps you to take the best areas To buy and sell because it make marks at the best a
- Real price is 80$ - 40% Discount (It is 49$ now) Contact me for instruction, add group and any questions! - Non-repaint - I just sell my products in Elif Kaya profile, any other websites are stolen old versions, So no any new updates or support. - Lifetime update free Related product:   Bitcoin Expert Introduction The breakout and retest strategy is traded support and resistance levels. it involves price breaking through a previous level.  The break and retest strategy is designed to help tr
KT Gaussian Trend Filter MT4
KEENBASE SOFTWARE SOLUTIONS
Le KT Gaussian Trend Filter combine le filtrage gaussien avec le lissage par régression linéaire pour fournir une analyse de tendance claire et précise. Il génère des signaux d'achat et de vente faciles à suivre tout en mettant en évidence la direction à long terme du marché. Fonctionnalités Filtre gaussien entièrement personnalisable : Ajustez la longueur et les pôles pour affiner la précision du lissage et améliorer la lisibilité de la tendance. Amélioration par régression linéaire : Affine d
Special offer : ALL TOOLS , just $35 each! New tools   will be   $30   for the   first week   or the   first 3 purchases !  Trading Tools Channel on MQL5 : Join my MQL5 channel to update the latest news from me L'indicateur Volumetric Order Blocks Multi Timeframe est un outil puissant conçu pour les traders cherchant à obtenir des informations approfondies sur le comportement du marché en identifiant les zones clés de prix où les participants importants accumulent des ordres. Ces zones, connues
Advanced Supply Demand
Bernhard Schweigert
4.91 (299)
Offre spéciale : 40 % de réduction La solution idéale pour les traders débutants comme experts ! Cet indicateur est un outil de trading unique, performant et abordable grâce à l’intégration de nombreuses fonctionnalités exclusives et d’une nouvelle formule. Cette mise à jour vous permet d’afficher des zones sur deux unités de temps. Vous pourrez ainsi visualiser non seulement une unité de temps supérieure, mais aussi l’unité de temps du graphique, ainsi que l’unité de temps supérieure : des z
Route Lines Prices - est un indicateur conçu pour identifier les directions des prix. Son interface simple intègre plusieurs algorithmes de calcul du comportement des prix et de leur direction future. Ces algorithmes incluent le calcul de la volatilité et le lissage des prix en fonction des unités de temps utilisées. L'indicateur possède un unique paramètre permettant de modifier la valeur « Calculating price values ». La valeur par défaut de 1 assure un calcul automatique équilibré, utilisabl
Stratos Pali
Michela Russo
4.43 (7)
Stratos Pali Indicator   is a revolutionary tool designed to enhance your trading strategy by accurately identifying market trends. This sophisticated indicator uses a unique algorithm to generate a complete histogram, which records when the trend is Long or Short. When a trend reversal occurs, an arrow appears, indicating the new direction of the trend. Important Information Revealed Leave a review and contact me via mql5 message to receive My Top 5 set files for Stratos Pali at no cost! Dow
Actuellement 40% de réduction ! La meilleure solution pour tout débutant ou trader expert ! Ce logiciel de tableau de bord fonctionne sur 28 paires de devises. Il est basé sur 2 de nos principaux indicateurs (Advanced Currency Strength 28 et Advanced Currency Impulse). Il donne un excellent aperçu de l'ensemble du marché Forex. Il montre les valeurs de l'Advanced Currency Strength, la vitesse de mouvement des devises et les signaux pour 28 paires de devises dans tous les (9) délais. Imaginez
Daily Candle Predictor est un indicateur qui prédit le cours de clôture d'une bougie. L'indicateur est principalement destiné à être utilisé sur les graphiques D1. Cet indicateur convient à la fois au trading forex traditionnel et au trading d'options binaires. L'indicateur peut être utilisé comme un système de trading autonome, ou il peut servir de complément à votre système de trading existant. Cet indicateur analyse la bougie actuelle, calcule certains facteurs de force à l'intérieur du corps
Scalper Vault
Oleg Rodin
5 (36)
Scalper Vault est un système de scalpage professionnel qui vous fournit tout ce dont vous avez besoin pour un scalpage réussi. Cet indicateur est un système de trading complet qui peut être utilisé par les traders de forex et d'options binaires. Le délai recommandé est M5. Le système vous fournit des signaux fléchés précis dans le sens de la tendance. Il vous fournit également des signaux supérieurs et inférieurs et des niveaux de marché Gann. Les indicateurs fournissent tous les types d'alertes
Indicateur Miraculous – Outil Forex et Binaire 100% Non-Repaint Basé sur le Carré de Neuf de Gann Cette vidéo présente l' Indicateur Miraculous , un outil de trading très précis et puissant, spécifiquement développé pour les traders du Forex et des Options Binaires . Ce qui rend cet indicateur unique est sa fondation sur le légendaire Carré de Neuf de Gann et la Loi de Vibration de Gann , en faisant l'un des outils de prévision les plus précis disponibles dans le trading moderne. L'Indicateur Mi
Plus de l'auteur
ZBeatZone
Sergio Andres Zuleta Lopez
5 (1)
The Z-Beat Zone is part of a suite of four indicators called the Z-Tools Black you can buy separately in the MetaTrader Market. The Z-Beat Zone is displayed as two lines. The main line is called SlowK. The second line, called SlowD. The SlowK line is a solid gross line and the SlowD line is a solid slim line. There are several ways to interpret a Z-Beat Zone. Three popular methods include: Buy when the Z-Beta Zone (The SlowK line) falls below of the level (e.g., -40) and then rises above that le
ZZone
Sergio Andres Zuleta Lopez
The Z-Zone is part of a suite of four indicators called the Z-Tools Black you can buy separately in the MetaTrader Market. The Z-Zone is based on the Market Profile and includes three dynamic lines: At the top is the resistance of zone (that we´ll identify as RoZ ) In the center we find the average distribution of the area (that we´ll identify as PoC ) At the bottom is the support of zone (that we´ll identify as SoZ ) Together they make up what we call the value zone, meaning that the market mo
ZLevels
Sergio Andres Zuleta Lopez
This indicator is based on Market Profile methodology, which contains the Z-Zone , unlike the latter, allows visualization of multiple time frames on the same graph. This methodology has proven to be very effective for: Reduce the number of windows required to analyze or track a financial asset. Display important resistance areas (ROZ), support (SoZ) and average distribution (PoC) in different periods of time. Define areas to take profits as well locate technical stop loss. Analysis in the devel
Filtrer:
Aucun avis
Répondre à l'avis