HTF Power of Three ICT MT4

HTF Power of Three (ICT) -  MT4 Indicator - Version 1.1

Overview

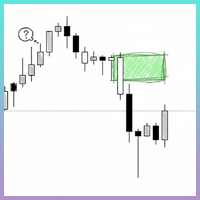
The HTF Power of Three indicator is a professional implementation of the Inner Circle Trader's (ICT) Power of Three concept, inspired by Larry Williams. This indicator visualizes higher timeframe (HTF) candle development in real-time on any lower timeframe chart, making it an essential tool for ICT traders who study institutional price movement patterns.

What is Power of Three (PO3)?

Power of Three represents a three-staged Smart Money campaign that occurs in every timeframe:

  1. ACCUMULATION - Smart money accumulates positions around the opening price
  2. MANIPULATION - Liquidity is engineered, stops are hunted, and weak hands are shaken out
  3. DISTRIBUTION - Smart money exits positions, pairing with pending interest

As ICT states: "This is applicable to every time measurement, as long as you have a beginning time, the highest value, the lowest value, and an ending in terms of measuring time."

Key Features

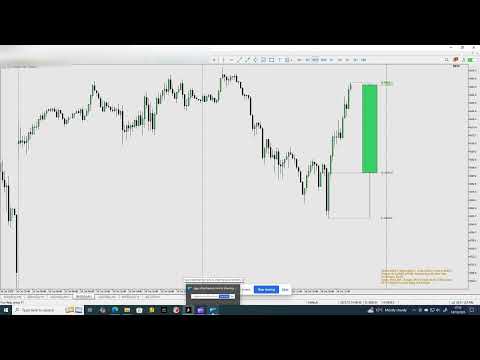
Visual HTF Candle Representation

  • Displays a single, clean HTF candle on the right side of your chart (multiple instances of the indicator can be used to show 2 or more candle, but the HTF parameter must be different between instances and also the offset from last candle must be changed from the default value). 
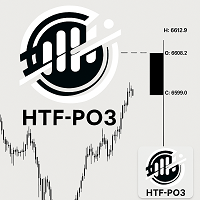
  • Shows real OHLC (Open, High, Low, Close) with proper body and wicks
  • Color-coded: Green for bullish candles, Red for bearish candles
  • Updates in real-time as the HTF candle develops

Reference Lines System

Three intelligent reference lines connect the HTF candle to your current price action:

  1. Open Reference Line - Connects from HTF period start to the candle's open
  2. High Reference Line - Extends from candle high to current time
  3. Low Reference Line - Extends from candle low to current time

These lines provide clear visual context of the HTF range development.

Advanced Phase Analysis 

This is what sets this version apart from others! The indicator includes intelligent PO3 phase detection displayed in the info panel:

  • ACCUMULATION - First third of HTF candle (0-33% completion)
  • MANIPULATION - Middle third, especially when price reaches extremes (33-66% completion)
  • EXPANSION - Active range development during manipulation phase
  • DISTRIBUTION - Final third of HTF candle (66-100% completion)

This automated phase analysis helps you understand WHERE you are in the institutional cycle at any moment.

Real-Time Countdown

The indicator shows exactly how many candles remain before the current HTF candle closes, allowing you to:

  • Time your entries with precision
  • Avoid entering late in the HTF cycle
  • Anticipate new HTF candle formation
  • Plan exits before distribution completes

Comprehensive Info Panel

Displays all critical information:

  • Current HTF timeframe and ratio (e.g., "H4 - Ratio: 1:4")
  • Candle type (Bullish/Bearish)
  • Range and body size in pips
  • Phase analysis (current PO3 stage)
  • Progress percentage and candle count
  • Countdown (candles remaining)
  • All OHLC price levels

Parameters

Higher Time Frame to represent (default: PERIOD_H4)

  • Select the Higher Time Frame to monitor
  • Available options: M1, M5, M15, M30, H1, H4, D1, W1, MN1
  • Must be higher than your current chart timeframe
  • The indicator automatically calculates the candle ratio

Examples:

  • Chart M5 + HTF H1 = 1:12 (12 M5 candles = 1 H1 candle)
  • Chart H1 + HTF H4 = 1:4 (4 H1 candles = 1 H4 candle)
  • Chart M15 + HTF D1 = 1:96 (96 M15 candles = 1 D1 candle)

Visual Settings

Offset from last candle (pixels) (default: 20)

  • Distance in pixels from the last chart candle to the HTF candle
  • Adjust to position the candle where you prefer on the right side

Candle width in pixels (default: 8)

  • Width of the HTF candle in pixels
  • Increase for better visibility, decrease for a more compact display

Bullish Candle Color (default: Lime)

  • Color for bullish HTF candles (Close > Open)

Bearish Candle Color (default: Red)

  • Color for bearish HTF candles (Close < Open)

Wick Color (default: Gray)

  • Color for candle wicks (upper and lower)

Outline Color (default: Black)

  • Color for the candle body outline

Show Candle Outline (default: true)

  • Toggle the black outline around the candle body

Reference Lines Settings

Show candle outline (default: true)

  • Enable/disable all three reference lines

    Connection lines color (default: Red)

    • Color for the connection lines

    Reference Line Style (default: STYLE_DOT)

    • Line style: STYLE_SOLID, STYLE_DASH, STYLE_DOT, STYLE_DASHDOT, STYLE_DASHDOTDOT

    Labels & Info Panel

    Show OHLC labels (default: true)

    • Display OHLC price labels next to the HTF candle

    Show info panel (default: true)

    • Display the comprehensive information panel

    Price label color (default: White)

    • Color for all text labels

    Price Label Font Size (default: 8)

    • Font size for labels and info panel

    Label Font (default: "Arial")

    • Font type for all text

    Info panel corner (default: CORNER_RIGHT_UPPER)

    • Position of the info panel on chart
    • Options: CORNER_LEFT_UPPER, CORNER_RIGHT_UPPER, CORNER_LEFT_LOWER, CORNER_RIGHT_LOWER

    Advanced Features

    Show countdown timer in info panel (default: true)

    • Display remaining candles until HTF candle closes
    • Essential for timing entries and exits

    Alert on new HTF candle (default: false)

    • Alert notification when a new HTF candle starts
    • Useful for multi-timeframe monitoring

    Why This Version is Superior

    Intelligent Phase Analysis

    Unlike basic HTF candle indicators that only show OHLC levels, this version includes automated PO3 phase detection. You can instantly see whether Smart Money is in:

    • Accumulation phase (building positions)
    • Manipulation phase (hunting stops, creating liquidity)
    • Expansion phase (active trend development)
    • Distribution phase (exiting positions)

    This analysis is based on time progress through the HTF candle and price position relative to the range, giving you institutional-level insight.

    Precision Countdown Timer

    The real-time countdown shows exactly how many candles remain before the HTF cycle completes. This is crucial because:

    • Entering during distribution (late stage) is high risk
    • Entering during accumulation (early stage) offers better R:R
    • You can anticipate manipulation phases
    • You know when to expect new HTF candle formation

    Complete Visual Context

    The three reference lines system provides unmatched clarity:

    • See exactly where the HTF period started
    • Understand how far price has travelled
    • Identify key institutional levels
    • Spot accumulation and distribution zones instantly

    Professional-Grade Implementation

    • Clean, non-cluttering single candle display
    • Pixel-perfect positioning that doesn't interfere with price action
    • Proper error handling (validates HTF > Chart TF)
    • Resource-efficient code
    • Compatible with all MT5 builds

    Use Cases

    Scalping & Day Trading

    • Use M15 or H1 HTF on M1/M5 charts
    • Enter during accumulation, exit before distribution
    • Use countdown to time precise entries

    Swing Trading

    • Use H4 or D1 HTF on H1/H4 charts
    • Identify larger institutional cycles
    • Avoid late entries by monitoring phase and countdown

    Multi-Timeframe Analysis

    • Stack multiple instances with different HTF settings
    • Monitor H1, H4, and D1 simultaneously on M15 chart
    • Align entries with multiple HTF cycles

    Backtesting & Study

    • Use MT5 Strategy Tester replay mode
    • Study historical PO3 patterns
    • Understand how institutions moved price
    • Perfect for ICT Mentorship students

      Tips for Best Results

      • Match HTF to your trading style: Scalpers use H1/H4, Swing traders use D1/W1
      • Use phase analysis: Only enter during accumulation phase for best R:R
      • Watch the countdown: Avoid entries when fewer than 30% of candles remain
      • Combine with other ICT concepts: Order blocks, Fair Value Gaps, Liquidity pools
      • Study in replay mode: Best way to learn PO3 patterns

      Support & Updates

      This indicator is designed for serious ICT traders who understand institutional price delivery. The phase analysis and countdown features make it an indispensable tool for timing entries within the Power of Three framework.

      Disclaimer: This indicator is for educational purposes. Always practice proper risk management and never risk more than you can afford to lose.

      Produits recommandés
      TITAN AI Volume Profile PRO MT4 is an advanced technical indicator designed for professional market analysis, volume profile distribution, and graphical data visualization in MetaTrader 4. Key Features: - Dynamic Volume Profile calculation based on price action and tick volume. - Automatic High Value Area (VAH), Low Value Area (VAL), and Point of Control (POC) detection. - High Volume Nodes (HVN) and Low Volume Nodes (LVN) highlighting. - Integrated Economic Calendar with news alerts. - Built-
      The "MR Volume Profile 4" indicator is a charting tool that displays trading volume at different price levels rather than time intervals. A key concept in volume profile is the point of control (POC)—the price level with the highest volume traded during the session or time range. While tools like VWAP or OBV provide volume trends, the "MR Volume Profile 4" indicator offers granular detail about where the most market activity occurs at specific price levels. This makes it a more precise tool for
      Deep Insight Candles is an indicator that brings an entirely new perspective to the price chart. It focuses on revealing hidden structures in market movements, uncovering buyer and seller pressure, thus helping traders to better identify key levels, dynamics, and potential reversals. The indicator conveys deeper market insights, allowing traders to make decisions based on a more accurate perception of market sentiment and pressure at specific price levels. This innovative approach transforms the
      The   MarketProfileTPO   indicator for MetaTrader 5 is a powerful tool designed to bring the   Market Profile concept, based on Time Price Opportunity (TPO) analysis , directly onto your main chart window. This indicator calculates and displays the price distribution over a specified period, highlighting key areas of market activity and concentration. It is particularly optimized for   high-volatility instruments   like   NAS100, US30, and XAUUSD   when used on the M1 (1-minute) timeframe, offer
      Aggressive TP SL
      Benwill Lopez Navarro
      NO REPAINT The system combines several analytical techniques and presents BUY/SELL signals in an easy-to-read form. You don’t have to be a professional to use it. Aggressive TP SL can make amazingly accurate market predictions by constantly auto-analyzing every price movement, trading patterns and with the help of complex trading algorithms. This  indicator main task is to look for gravity zones and generate buy/sell signal with exact SL and TPs location.     When specified conditions are fulfi
      Volume Delta Scanner MT4
      Mariusz Franciszek Szczepanczyk
      Scanner Delta Volume MT4 Volume Delta Scanner est un indicateur de marché en temps réel pour MetaTrader 4 qui surveille simultanément plusieurs symboles et unités de temps depuis un seul panneau. Au lieu de passer manuellement d'un graphique à l'autre, vous obtenez instantanément une vue d'ensemble de la pression acheteuse et vendeuse sur l'ensemble de votre liste de surveillance. Cet indicateur est basé sur la logique du Delta de volume : il calcule la différence entre la pression à l’achat
      Blahtech Market Profile
      Blahtech Limited
      4.53 (15)
      Was: $249  Now: $99   Market Profile defines a number of day types that can help the trader to determine market behaviour. A key feature is the Value Area, representing the range of price action where 70% of trading took place. Understanding the Value Area can give traders valuable insight into market direction and establish the higher odds trade. It is an excellent addition to any system you may be using. Blahtech Limited presents their Market Profile indicator for the MetaTrader community. Ins
      Hedge Trading King
      Stefano Frisetti
      5 (1)
      Hedge Trading Monitor is my indicator that instantly monitors the difference or ratio between two assets useful for hedge trading. How to use it + Download the indicator + Apply the indicator on an open chart + You can change the assets using the settings. Distribution + It is distributed only on MQL5.vom + Free license (FREE) - Contact me privately on MQL5.com: send me a message
      FREE
      Scalping Snake Pro est un indicateur de scalping unique qui montre au trader les moments d'inversion des prix et ne redessine pas. Cet indicateur, contrairement à beaucoup d'autres sur Internet, ne redessine pas ses valeurs. Il dessine des signaux sur la toute première barre, ce qui vous permet de ne pas être en retard avec l'ouverture des offres. Cet indicateur envoie des notifications au commerçant par téléphone et par e-mail lorsqu'un signal apparaît. Vous obtenez toutes ces fonctionnalités
      GND Tail Candle
      Nguyen Dang Giang
      A tall upper shadow occurs when the price moves during the period, but goes back down, which is a bearish signal. A tall lower shadow forms when bears push the price down, but bulls pull it back up, which leaves a long line or shadow. This is considered a bullish signal. Some technical analysts believe a tall or long shadow means the stock will turn or reverse. Some believe a short or lower shadow means a price rise is coming. In other words, a tall upper shadow means a downturn is coming, while

      Simply The Best Pro
      Szymon Palczynski
      5 (1)
      This indicator displays the histogram and arrows on chart. When Simple The Best Pro are placed on a chart, they identify the trend.  The color of may be blue or red. The blue color stands for upside moves and the red color stands for downside trends. The indicator offers to set Stop Loss (SL) and  Take Profit (TP)  setting. The default value is ATR. Indicator has automatic optimization. The STB is a unique indicator that shows the tendency (button Bars) of a particular signals. The STB tells us
      This indicator incorporates built-in volume statistics, identifying true liquidity zones based on real-time trading volume and comparing it to the volume of the last 500 candlesticks. Based on the identified results, liquidity zones are plotted on the chart, indicating potential price swings. We typically identify key liquidity zones that have not yet been breached in larger timeframes, then look for suitable entry opportunities in smaller timeframes. When the price touches a key liquidity zone
      VPO Profile MT4
      Kyra Nickaline Watson-gordon
      5 (2)
      Definition : VPO is a Volume Price Opportunity. Instead of using bars or candles with an Open, High, Low, and Close price, each "bar" in a Market Profile is represented by horizontal bars against the price It is called Market Profile terminology. In other words volume-price-opportunity (VPO) profiles are histograms of how many volumes were traded at each price within the span of the profile. By using a VPO chart, you are able to analyze the amount of trading activity, based on volume, for each
      Le Volume Profile est l'un des outils analytiques les plus puissants utilisés par les traders professionnels et institutionnels. Contrairement aux indicateurs de volume traditionnels qui montrent uniquement le moment où les transactions se sont produites en bas de votre écran, le Volume Profile montre exactement à quels niveaux de prix ces transactions ont eu lieu. Cela vous donne une vision radiographique claire de la structure du marché, vous permettant de voir exactement où la smart money (ar

      Volume Profile Sniper v11. 1-un outil Complet pour l'analyse du marché Approche professionnelle du commerce Volume Profile Sniper V11.1 combine plus de 15 filtres clés dans un seul indicateur, fournissant des signaux clairs basés sur une évaluation complète de la situation du marché. Principales caractéristiques Analyse du déséquilibre volumétrique-l'algorithme calcule la proportion d'acheteurs et de vendeurs dans chaque bougie, signalant la prédominance de l'une des parties (seuil configurabl
      Concept of  Market Profile  was created at Chicago Board of Trade (CBOT) by trader   Peter Steidlmayer  and first published during the 1980s as CBOT product. Market profile by itself is not a stand-alone strategy, but a different way how you can view the market and make better trading decisions. They have seen a market as an auction process which is affected by supply and demand the same way as every other auction, for example, development of prices of food, gas etc. The price goes up as long th
      Volume indicator Effect Volume , in the Forex market volumes are unique (tick). This volume indicator demonstrates the level of financial and emotional involvement. When the indicator forms a new top, it indicates that buyers are stronger than sellers over a certain period of time. If the indicator decreases, this indicates that the bears are stronger. Why is it impossible to track normal volumes in Forex? The fact is that this is an over-the-counter market. Consequently, it is practically imp
      Power Index Fx is a new generation indicator that allows an intelligent multi Timeframe analysis. The indicator is flexible and completely customizable. Its positioning in separate window makes it unobtrusive and extremely functional. Its formula of calculation makes it a fundamental tool for identifying possible moments of continuation in favor of Trend. Power Index Fx is a professional tool able to increase your operational potential. Input Values DASHBOARD SETTINGS How many symbols to show 2
      Like the logic of this tool? Explore the full ecosystem of professional indicators and utilities, built by a trader for traders: All author's products in MQL5 Market: https://www.mql5.com/en/users/musa1994/seller Trading philosophy and details: https://developer-mql4-mql5.netlify.app/ Liquidity + Volume Pro is a professional MetaTrader 4 indicator that combines liquidity and volume analysis into one system. Detects level sweeps, filters by volume, scores signal strength, and builds Supp
      Matrixs
      Andriy Sydoruk
      Matrix is a Forex arrow indicator. Displays signals simply and clearly! The arrows show the direction of the transaction, and are colored accordingly, which can be seen in the screenshots. As you can see, trading with such an indicator is easy. I waited for an arrow to appear in the desired direction - I opened a deal. An arrow formed in the opposite direction - closed the deal. The indicator also displays the lines with the help of which the arrow signals are formed, taking into account the int
      Let us introduce you to a new era of neural indicators for financial markets! Intelligent Moving is a unique indicator that trains its neural network in real time! You no longer need to look for the optimal indicator parameters for each specific situation. No more late signals. The artificial intelligence is able to adapt itself and predict any market movements. Visually, the indicator is drawn as a main solid moving average line, two dotted lines of standard deviations and signal arrows. For
      Adaptive Volume Profile dessine le Profil de Volume des dernières barres directement sur le graphique : le Point of Control (POC), la Value Area (VAH / VAL), les nœuds de volume élevé (HVN), les nœuds de faible volume (LVN) et un histogramme de volume optionnel. La taille des lignes de prix s'adapte à la volatilité actuelle (ATR), de sorte que le profil reste lisible sur tout symbole et toute unité de temps. Fonctionnalités POC - le niveau de prix avec le plus grand volume échangé dans la fenêtr
      FREE
      This multicurrency indicator is the Lite version of the Cosmic Diviner Reversal Zone Pro indicator. The indicator is based on original formulas for analyzing the volatility and price movement strength. This allows determining the overbought and oversold states of instruments with great flexibility, as well as setting custom levels for opening buy or sell orders when the overbought or oversold values of the instruments reach a user-defined percentage. A huge advantage of Reversal Zone Lite is the
      Apollo SR Master est un indicateur de support/résistance doté de fonctionnalités spéciales qui simplifient et fiabilisent le trading basé sur les zones de support/résistance. Cet indicateur calcule ces zones en temps réel, sans aucun décalage, en détectant les sommets et les creux locaux des prix. Pour confirmer la nouvelle zone de support/résistance, il affiche un signal spécifique indiquant que cette zone peut être prise en compte et utilisée comme un véritable signal d'achat ou de vente. Dans
      Bullish Bearish Volume — Measured Participation for MT4  Most volume indicators ship with settings somebody liked the look of. This one ships with settings measured against historical market data. Bullish Bearish Volume was developed using research covering 146,764 hourly EUR/USD bars from 2003 to 2026 . Instead of relying on conventional moving-average periods or visual optimisation, its settings are informed by measurements of volume seasonality, smoothing lag, clock bias and directional beh
      HIZOA Volume Reversal Flow Volume Pressure, Reversal Development and Directional Confirmation HIZOA Volume Reversal Flow is an analytical volume oscillator designed to visualise bullish and bearish pressure, identify developing volume reversals and reduce distracting counter-flow noise during clearer directional conditions. Instead of treating every opposing volume bar as equally meaningful, the indicator evaluates volume intensity, directional flow, price behaviour and multi-stage follow-thr
      Paid release: Delta Volume Profile Zones MT4 is a paid MetaCoderStore indicator. Use the product comments for setup questions, feature requests, and feedback for future updates. Delta Volume Profile Zones is a compact volume-profile indicator for traders who want price-level context without turning the chart into a crowded footprint screen. It builds a rolling profile from recent candles and marks the key zones traders usually watch: Point of Control, Value Area High, Value Area Low, high-volume
      Naked Forex Big Shadow IndicatorBig Shadow Indicator is a pattern recognition indicator for Forex, Stocks, Indices, Futures, Commodities and Cryptos. When you have a Big Shadow on your chart then this is a strong signal meaning that you might be ahead of a reversal. You can take other elements (momentum, trend, volatility, price action, fundamentals) to build a complete strategy and confirm your entries. Beware that you might not make money just following the arrows generated by the pattern reco
      IceFX VelocityMeter Mini is a very unique indicator on MetaTrader 4 platform which measures the speed of the Forex market . It is not a normal volume or other measurement indicator because IceFX VelocityMeter Mini is capable to understand market speed movements which are hidden in ticks and those valuable information cannot be read in an ordinary way from the candles. The software monitors the received ticks (frequency, magnitude of change) within a specified time range, analyzes these info and
      The indicator allows you to trade binary options. The recommended time frame is М1 and the expiration time is 1,2,3 minutes. The indicator suitable for auto and manual trading. A possible signal is specified as a arrows above/under a candle. You should wait until the candle closes! Arrows are not re-painted Trade sessions: TOKYO section (Half-end) Currency pairs: USD/JPY Working time frame: M1 Expiration time: 1,2,3 minutes. The indicator also shows good results when using the martingale strateg
      FREE
      Les acheteurs de ce produit ont également acheté
      Trend SniperX MT4
      Sarvarbek Abduvoxobov
      5 (5)
      Trend Sniper X est un indicateur de suivi de tendance multi-temporalité pour MetaTrader 5 qui aide les traders à identifier la direction de la tendance et les points de retournement potentiels avec clarté et précision. Pour MT5 : https://www.mql5.com/en/market/product/181101 Information sur le prix : Le prix actuel est une offre promotionnelle et peut évoluer au fur et à mesure de la sortie des prochaines mises à jour et nouvelles fonctionnalités. Canal Code2Profit Maîtrisez le marché grâce à l'
      Scalper Vault
      Oleg Rodin
      5 (40)
      Scalper Vault est un système de trading puissant et complet, conçu pour les traders en quête de régularité dans le cadre du trading intrajournalier. Cet indicateur de haute précision constitue un système de trading autonome et exhaustif, offrant des analyses de qualité institutionnelle, aussi bien pour le Forex que pour les options binaires. VEUILLEZ ME CONTACTER APRÈS VOTRE ACHAT POUR OBTENIR MES CONSEILS DE TRADING AINSI QU'UN EXCELLENT BONUS ! En éliminant les incertitudes et les analyses ma
      Currency Strength Wizard est un indicateur très puissant qui vous offre une solution tout-en-un pour un trading réussi. L'indicateur calcule la puissance de telle ou telle paire de devises en utilisant les données de toutes les devises sur plusieurs périodes. Ces données sont représentées sous la forme d'un indice de devise facile à utiliser et de lignes électriques de devise que vous pouvez utiliser pour voir la puissance de telle ou telle devise. Tout ce dont vous avez besoin est d'attacher l'
      Le système PRO Renko est un système de trading très précis spécialement conçu pour le trading de graphiques RENKO. Il s'agit d'un système universel qui peut être appliqué à divers instruments de négociation. Le système neutralise efficacement ce qu'on appelle le bruit du marché en vous donnant accès à des signaux d'inversion précis. L'indicateur est très facile à utiliser et n'a qu'un seul paramètre responsable de la génération du signal. Vous pouvez facilement adapter l'outil à n'importe que
      SR Liquidity
      Oleg Rodin
      5 (2)
      SR Liquidity est un indicateur de trading conçu pour révéler les zones cachées où se concentre la liquidité du marché et où le prix réagit avec le plus d'intensité. Ces zones de liquidité spécifiques agissent comme de puissants niveaux de support et de résistance, vous offrant une cartographie claire des points où le marché est le plus susceptible de se retourner. Plutôt que de tracer des lignes de support et de résistance classiques, l'indicateur SR Liquidity analyse le comportement réel des pr
      Atomic Analyst
      Issam Kassas
      5 (14)
      Atomic Analyst — MetaTrader 4 Pour toute question sur le produit, sa configuration ou le support technique, envoyez-moi un message directement ici sur MQL5. L’indicateur transforme des calculs complexes du marché en signaux visuels simples, bougies colorées, lectures de tendance, niveaux de stop-loss et plusieurs zones de take-profit que les traders peuvent comprendre rapidement et utiliser dans des conditions réelles de marché. Principales utilisations de trading : Scalping et trading intraday
      Smart Trend Trading System est un indicateur pour MetaTrader 4 qui réunit les informations de tendance, les signaux d’entrée et de sortie et les niveaux de prix sur un même graphique. Il combine plus de 10 outils de trading en un seul système, incluant la détection de tendance, les zones de retournement, Smart Cloud, la logique de trailing stop, le support et la résistance, la coloration des bougies, les alertes et l’analyse multi-timeframe. Le système est conçu pour vous aider à trader différen
      SIO Oscillator : oscillateur auto-optimisé de déséquilibre de semi-variance Achetez l’indicateur et recevez GRATUITEMENT l’Expert Advisor (EA) basé sur celui-ci. La plupart des oscillateurs traitent tous les mouvements de prix de la même manière. SIO sépare la pression haussière de la pression baissière et mesure le déséquilibre entre les deux, montrant quel camp contrôle réellement le marché : les acheteurs ou les vendeurs. Lorsque le déséquilibre atteint un extrême, SIO génère un signal clair
      Quant Direction
      Georgios Kalomoiropoulos
      Quant Direction est un outil d'analyse de marché 3D. Il fournit une analyse de marché parfaitement objective, basée sur un algorithme, en calculant des écarts précis en pourcentage sur différents paramètres. Développé à l'aide d'outils de modélisation avancés basés sur l'IA et soumis à des tests rigoureux, cet algorithme analyse le marché avec une précision inégalée. Vous pouvez analyser n'importe quelle paire de devises ou instrument financier sur la plateforme. Que vous pratiquiez le trading à
      Trend Lines PRO
      Roman Podpora
      5 (2)
      TREND LINES PRO     Cet indicateur permet de comprendre les véritables changements de direction du marché. Il révèle les renversements de tendance et les points de retour des principaux acteurs. Tu vois     Lignes BOS     Détection des changements de tendance et des niveaux clés sur des unités de temps supérieures, sans paramètres complexes ni interférences inutiles. Les signaux restent affichés sur le graphique même après la fermeture de la bougie. VERSION MT 5    -     Révèle son potentiel max
      AW Prime Oscillator
      AW Trading Software Limited
      5 (1)
      Une combinaison de deux oscillateurs. Le premier affiche les points d'entrée, le second montre la tendance actuelle. L'indicateur peut afficher les signaux d'oscillateur par des flèches dans deux modes, tous les signaux d'oscillateur rapides ou les signaux uniquement dans la direction de la tendance actuelle. Il dispose d'un panneau multi-périodes et de trois types de notifications de signal. Avantages: Convient au day trading et au scalping Filtrage des tendances Configuration simple et sensibl
      M1 Sniper
      Oleg Rodin
      4.97 (30)
      M1 SNIPER est un système d'indicateurs de trading facile à utiliser. Il s'agit d'un indicateur à flèche conçu pour l'unité de temps M1. Cet indicateur peut être utilisé seul pour le scalping sur l'unité de temps M1 ou intégré à votre système de trading existant. Bien que conçu spécifiquement pour le trading sur l'unité de temps M1, ce système peut également être utilisé avec d'autres unités de temps. Initialement, j'avais conçu cette méthode pour le trading du XAUUSD et du BTCUSD. Cependant, je
      Hidden Cycles
      Lev Vladimirovic Marushkin
      5 (1)
      The Only 100% Universal Tool! Stop trading against nature! This is your chance to secure the only indicator rooted in the absolute laws that govern the entire universe. Most tools guess—this one reveals the truth. Buy another toy or buy the truth. Your choice... Based on Universal Laws — NOT Some Guy’s Algorithm: Let the market adjust to the Hidden Cycles Geometry — not the other way around. Most indicators are based on a man-made formula. They often lag, fail over time, or need constant re-o
      Neo Wave PRO
      Nikolay Raykov
      5 (1)
      Price & Time Market Structure Indicator A professional market structure tool that analyzes waves through both price and time — not price alone. Main Description NeoWave PRO is a professional market structure indicator for MetaTrader 4 designed for traders who want to move beyond traditional one-dimensional wave tools such as ZigZag, swing indicators, and basic high/low systems. Most wave indicators analyze only one thing: Price. But a real market wave is not only a price movement. A true wave de
      Identify key turning points with reliable fractal analysis This indicator examines the price structure of fractals of different periods to determine possible reversal points in the market, providing timing to positional traders that already have a fundamental or technical valuation model. Unlike its younger brother, Reversal Fractals , this indicator won't miss reversals because of the period selected, and will find reversal fractals on a zig-zag fashion, ignoring those reversals which do not
      CRT Multi-Timeframe Market Structure & Liquidity Sweep Indicator Non-Repainting | Multi-Asset | MT5 Version Available MT5 Version:   https://www.mql5.com/en/market/product/162075 Full User Guide — explains what each feature does and why:   https://www.mql5.com/en/blogs/post/767525 Quick Start User Guide  — explains how to configure and in what order:  https://www.mql5.com/en/blogs/post/767540 Indicator Overview CRT Ghost Candle HTF Fractal is a complete institutional-grade market structure too
      Gann Time Clusters
      Martin Eshleman
      2.5 (2)
      Gann Time Clusters Indicator This indicator is based on W. D. Gann's Square of 9 method for the time axis. It uses past market reversal points and applies the mathematical formula for Gann's Square of 9 and then makes projections into the future. A date/time where future projections line up is called a 'time cluster'. These time clusters are drawn as vertical lines on the right side of the chart where the market has not advanced to yet. A time cluster will result in a market reversal point (ex.
      Neuro Poseidon MT4
      Daria Rezueva
      4.74 (46)
      Neuro Poseidon is a new indicator by Daria Rezueva. It combines precise trading signals with adaptive TP/SL levels - creating best possible trades as a result! Message me and get  Neuro Poseidon Assistant  as a gift to automize your trading process! What makes it stand out? 1. Proven profitability on all assets and timeframes 2. Only confirmed BUY and SELL signals present on the chart 3. Adaptive TP & SL levels generated by the software for each trade 4. Easy to understand - suitable for all
      Non repaint MT4
      Yan Zhen Du
      5 (1)
      This is a professional chart indicator designed for traders focused on stability and clear price action. It helps filter market noise and provides clear visual entry and exit zones for your trading decisions. Core Features: Strictly Non-Repainting: The system is built with strict non-repaint logic. What you see on the chart is the true historical performance. Confirmed Signals: Signals are triggered and confirmed only after the candle closes . Once a trading arrow appears on a closed candle, it
      Forex Breath System est un système de trading basé sur les tendances qui peut être utilisé sur n'importe quel marché. Vous pouvez utiliser ce système avec des devises, des métaux, des matières premières, des indices, des cryptomonnaies et même des actions. Il peut également être utilisé à tout moment. Le système est universel. Il montre la tendance et fournit des signaux fléchés avec la tendance. L'indicateur peut également vous fournir un type spécial d'alertes lorsque les signaux apparaissent
      Advanced Supply Demand
      Bernhard Schweigert
      4.91 (302)
      Offre spéciale : 30 % de réduction La solution idéale pour les traders débutants comme experts ! Cet indicateur est un outil de trading unique, performant et abordable grâce à l’intégration de nombreuses fonctionnalités exclusives et d’une nouvelle formule. Cette mise à jour vous permet d’afficher des zones sur deux unités de temps. Vous pourrez ainsi visualiser non seulement une unité de temps supérieure, mais aussi l’unité de temps du graphique, ainsi que l’unité de temps supérieure : des z
      Super Signal – Skyblade Edition Système de signaux de tendance professionnel sans repaint / sans latence, avec un taux de réussite exceptionnel | Pour MT4 / MT5 Il fonctionne mieux sur des unités de temps inférieures, comme 1 minute, 5 minutes et 15 minutes. Caractéristiques principales : Super Signal – Skyblade Edition est un système de signaux intelligent conçu spécifiquement pour le trading de tendance. Il utilise une logique de filtrage multicouche pour détecter uniquement les mouvements d
      Liquidity Scalper System : un système de trading basé sur la liquidité au format indicateur. La plupart des indicateurs n'affichent qu'une flèche, puis le trader décide seul où placer le stop, où se trouve l'objectif et s'il peut faire confiance au signal. Liquidity Scalper System couvre tout le cycle du trade : il trouve les pools de liquidité, donne un signal lors de leur cassure, calcule immédiatement Entry, Stop Loss et trois objectifs, et affiche sur le panneau les statistiques et les résu
      Gann Made Easy
      Oleg Rodin
      4.84 (174)
      Gann Made Easy est un système de trading Forex professionnel et facile à utiliser qui est basé sur les meilleurs principes de trading en utilisant la théorie de mr. WD Gann. L'indicateur fournit des signaux d'ACHAT et de VENTE précis, y compris les niveaux Stop Loss et Take Profit. Vous pouvez échanger même en déplacement en utilisant les notifications PUSH. VEUILLEZ ME CONTACTER APRÈS L'ACHAT POUR RECEVOIR GRATUITEMENT DES INSTRUCTIONS DE TRADING ET D'EXCELLENTS INDICATEURS SUPPLÉMENTAIRES! Vou
      ACTUELLEMENT 40% DE RÉDUCTION La meilleure solution pour tout débutant ou trader expert ! Cet indicateur est un outil de trading unique, de haute qualité et abordable car nous avons incorporé un certain nombre de caractéristiques exclusives et une nouvelle formule. Avec seulement UN graphique, vous pouvez lire la force de la devise pour 28 paires Forex ! Imaginez comment votre trading va s'améliorer parce que vous êtes capable de repérer le point de déclenchement exact d'une nouvelle tendance
      Gold Channel is a volatility-based indicator, developed with a specific timing algorithm for the XAUUSD pair, which consists of finding possible corrections in the market. This indicator shows two outer lines, an inner line (retracement line) and an arrow sign, where the theory of the channel is to help identify overbought and oversold conditions in the market. The market price will generally fall between the boundaries of the channel. If prices touch or move outside the channel it is a tradi
      Actuellement 30% de réduction ! La meilleure solution pour tout débutant ou trader expert ! Ce logiciel de tableau de bord fonctionne sur 28 paires de devises. Il est basé sur 2 de nos principaux indicateurs (Advanced Currency Strength 28 et Advanced Currency Impulse). Il donne un excellent aperçu de l'ensemble du marché Forex. Il montre les valeurs de l'Advanced Currency Strength, la vitesse de mouvement des devises et les signaux pour 28 paires de devises dans tous les (9) délais. Imaginez
      TDI Multi Timeframe Scanner: This Dashboard indicator uses the TDI (Trader's Dynamic Index) Indicator to find best trades. Read detailed How to Use Guide: https://www.mql5.com/en/blogs/post/758252 Extra indicators also available in above post. Checks for: - SharkFin Pattern Free indicator for SharkFin: https://www.mql5.com/en/market/product/42405/ - TDI Trend: Strong/Weak Trend Up/Down - TDI Signal: Strong/Medium/Weak Signal for Buy/Sell - Consolidation - Overbought/Oversold - Volatility Ban
      Italo Trend Indicator
      Italo Santana Gomes
      4.74 (34)
      BUY INDICATOR AND GET EA FOR FREE AS A BONUS + SOME OTHER GIFTS! ITALO TREND INDICATOR  is the best trend indicator on the market, the Indicator works on all time-frames and assets, indicator built after 7 years of experience on forex and many other markets. You know many trend indicators around the internet are not complete, does not help, and it's difficult to trade, but the Italo Trend Indicator is different , the Italo Trend Indicator shows the signal to buy or sell, to confirm the signal t
      Top Bottom Tracker est un indicateur basé sur des algorithmes sophistiqués qui analyse la tendance du marché et peut détecter les hauts et les bas de la tendance / Version MT5 . Le prix augmentera progressivement jusqu'à ce qu'il atteigne 500$. Prochain prix --> 99$ Caractéristiques Pas de repeinture Cet indicateur ne change pas ses valeurs lorsque de nouvelles données arrivent Paires de trading Toutes les paires de devises Période de temps Toutes les périodes de temps Paramètres de
      Plus de l'auteur
      Market 3 Sessions Indicator
      Antonio Molinaro
      3.67 (3)
      Session Box Indicator for MetaTrader 5 IMPORTANT NOTE: **A new input parameter ( Skip weekends  )  has been introduced which must be set to false for markets opened 24/7** Version 1.00 Release Version 1.01 Complete code rewrite Version 1.02 Fix: added missing font name and removed emoji as session name, added label positioning Version 1.03 Fix: proper weekend handling, complete minute support for all sessions, independent label position Description: The SessionBox indicator is designed to visu
      FREE
      Session Box Indicator for MetaTrader 4 IMPORTANT NOTE: **A new input parameter ( Skip weekends  )  has been introduced which must be set to false for markets opened 24/7** Version 1.00 Release Version 1.01 Complete code rewrite Version 1.02 Fix: added missing font name and removed emoji as session name, added label positioning Version 1.03 Fix: proper weekend handling, complete minute support for all sessions, independent label position Description: The SessionBox indicator is designed to visu
      Range Bar Pro
      Antonio Molinaro
      Range Bar Pro Indicator for MetaTrader 5 Visualize market trends, levels and other features with Range Bar Pro, an innovative indicator that draws a unique, standalone candle on the right side of any MT5 chart. This single candle is generated from an analysis of price over a specified range, providing you with a powerful snapshot of the market. Key Features: Single-Candle Visualization: Gain quick insights with a single, specially derived candle that reflects comprehensive price movement over a
      ADX-Based Candle Color Indicator for MT5 Description:   Enhance your trading experience with the ADX-Based Candle Color Indicator for MT5! This powerful tool colors candlesticks based on the Average Directional Index (ADX) indicator, helping you quickly assess market strength and direction at a glance. Key Features:   - Color-Coded Candles:     - Green (Bullish) when D+ > D-.     - Red (Bearish) when D- > D+.   - Intensity Mapping:       The color intensity reflects the ADX value—stronger col
      HTF Power of Three ICT
      Antonio Molinaro
      5 (2)
      HTF Power of Three (ICT) -  MT5 Indicator - Version 1.1 Overview The HTF Power of Three indicator is a professional implementation of the Inner Circle Trader's (ICT) Power of Three concept, inspired by Larry Williams. This indicator visualizes higher timeframe (HTF) candle development in real-time on any lower timeframe chart, making it an essential tool for ICT traders who study institutional price movement patterns. What is Power of Three (PO3)? Power of Three represents a three-staged Smart M
      Footprint Indicator for MT5 NOTE: LIMITED TIME PRICE *** ONLY £30 1. Introduction  This Indicator provides a real-time footprint and volume profile visualization per candle directly on MetaTrader 5 charts, allowing traders to analyze order flow, volume distribution, and market pressure with precision.  2. Installation  1. Copy the Indicator file into the MetaTrader 5 /Indicators folder.  2. Restart MetaTrader 5.  3. Drag the Indicator onto a chart.  3. Indicator Overview  The Indicator rende
      In trading, the Master Pattern (sometimes called the market master pattern ) is a conceptual framework describing how price typically moves as capital flows through markets. It is not a rule-set, but a recurring structural sequence driven by institutional behaviour, liquidity, and crowd psychology. Different trading schools describe it with different names, but the underlying logic is largely the same. Core Idea Markets tend to move through a repeating cycle: Accumulation → Expansion → Distribut
      Filtrer:
      Aucun avis
      Répondre à l'avis