HTF Power of Three ICT MT4

HTF Power of Three (ICT) -  MT4 Indicator - Version 1.1

Overview

The HTF Power of Three indicator is a professional implementation of the Inner Circle Trader's (ICT) Power of Three concept, inspired by Larry Williams. This indicator visualizes higher timeframe (HTF) candle development in real-time on any lower timeframe chart, making it an essential tool for ICT traders who study institutional price movement patterns.

What is Power of Three (PO3)?

Power of Three represents a three-staged Smart Money campaign that occurs in every timeframe:

  1. ACCUMULATION - Smart money accumulates positions around the opening price
  2. MANIPULATION - Liquidity is engineered, stops are hunted, and weak hands are shaken out
  3. DISTRIBUTION - Smart money exits positions, pairing with pending interest

As ICT states: "This is applicable to every time measurement, as long as you have a beginning time, the highest value, the lowest value, and an ending in terms of measuring time."

Key Features

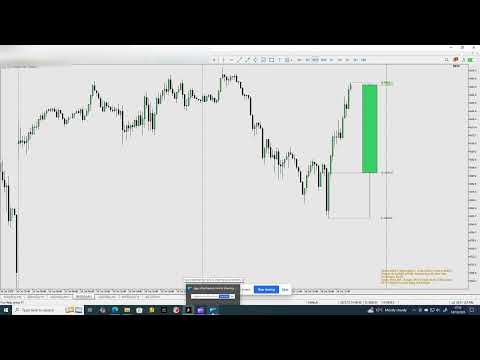
Visual HTF Candle Representation

  • Displays a single, clean HTF candle on the right side of your chart (multiple instances of the indicator can be used to show 2 or more candle, but the HTF parameter must be different between instances and also the offset from last candle must be changed from the default value). 
  • Shows real OHLC (Open, High, Low, Close) with proper body and wicks
  • Color-coded: Green for bullish candles, Red for bearish candles
  • Updates in real-time as the HTF candle develops

Reference Lines System

Three intelligent reference lines connect the HTF candle to your current price action:

  1. Open Reference Line - Connects from HTF period start to the candle's open
  2. High Reference Line - Extends from candle high to current time
  3. Low Reference Line - Extends from candle low to current time

These lines provide clear visual context of the HTF range development.

Advanced Phase Analysis 

This is what sets this version apart from others! The indicator includes intelligent PO3 phase detection displayed in the info panel:

  • ACCUMULATION - First third of HTF candle (0-33% completion)
  • MANIPULATION - Middle third, especially when price reaches extremes (33-66% completion)
  • EXPANSION - Active range development during manipulation phase
  • DISTRIBUTION - Final third of HTF candle (66-100% completion)

This automated phase analysis helps you understand WHERE you are in the institutional cycle at any moment.

Real-Time Countdown

The indicator shows exactly how many candles remain before the current HTF candle closes, allowing you to:

  • Time your entries with precision
  • Avoid entering late in the HTF cycle
  • Anticipate new HTF candle formation
  • Plan exits before distribution completes

Comprehensive Info Panel

Displays all critical information:

  • Current HTF timeframe and ratio (e.g., "H4 - Ratio: 1:4")
  • Candle type (Bullish/Bearish)
  • Range and body size in pips
  • Phase analysis (current PO3 stage)
  • Progress percentage and candle count
  • Countdown (candles remaining)
  • All OHLC price levels

Parameters

Higher Time Frame to represent (default: PERIOD_H4)

  • Select the Higher Time Frame to monitor
  • Available options: M1, M5, M15, M30, H1, H4, D1, W1, MN1
  • Must be higher than your current chart timeframe
  • The indicator automatically calculates the candle ratio

Examples:

  • Chart M5 + HTF H1 = 1:12 (12 M5 candles = 1 H1 candle)
  • Chart H1 + HTF H4 = 1:4 (4 H1 candles = 1 H4 candle)
  • Chart M15 + HTF D1 = 1:96 (96 M15 candles = 1 D1 candle)

Visual Settings

Offset from last candle (pixels) (default: 20)

  • Distance in pixels from the last chart candle to the HTF candle
  • Adjust to position the candle where you prefer on the right side

Candle width in pixels (default: 8)

  • Width of the HTF candle in pixels
  • Increase for better visibility, decrease for a more compact display

Bullish Candle Color (default: Lime)

  • Color for bullish HTF candles (Close > Open)

Bearish Candle Color (default: Red)

  • Color for bearish HTF candles (Close < Open)

Wick Color (default: Gray)

  • Color for candle wicks (upper and lower)

Outline Color (default: Black)

  • Color for the candle body outline

Show Candle Outline (default: true)

  • Toggle the black outline around the candle body

Reference Lines Settings

Show candle outline (default: true)

  • Enable/disable all three reference lines

    Connection lines color (default: Red)

    • Color for the connection lines

    Reference Line Style (default: STYLE_DOT)

    • Line style: STYLE_SOLID, STYLE_DASH, STYLE_DOT, STYLE_DASHDOT, STYLE_DASHDOTDOT

    Labels & Info Panel

    Show OHLC labels (default: true)

    • Display OHLC price labels next to the HTF candle

    Show info panel (default: true)

    • Display the comprehensive information panel

    Price label color (default: White)

    • Color for all text labels

    Price Label Font Size (default: 8)

    • Font size for labels and info panel

    Label Font (default: "Arial")

    • Font type for all text

    Info panel corner (default: CORNER_RIGHT_UPPER)

    • Position of the info panel on chart
    • Options: CORNER_LEFT_UPPER, CORNER_RIGHT_UPPER, CORNER_LEFT_LOWER, CORNER_RIGHT_LOWER

    Advanced Features

    Show countdown timer in info panel (default: true)

    • Display remaining candles until HTF candle closes
    • Essential for timing entries and exits

    Alert on new HTF candle (default: false)

    • Alert notification when a new HTF candle starts
    • Useful for multi-timeframe monitoring

    Why This Version is Superior

    Intelligent Phase Analysis

    Unlike basic HTF candle indicators that only show OHLC levels, this version includes automated PO3 phase detection. You can instantly see whether Smart Money is in:

    • Accumulation phase (building positions)
    • Manipulation phase (hunting stops, creating liquidity)
    • Expansion phase (active trend development)
    • Distribution phase (exiting positions)

    This analysis is based on time progress through the HTF candle and price position relative to the range, giving you institutional-level insight.

    Precision Countdown Timer

    The real-time countdown shows exactly how many candles remain before the HTF cycle completes. This is crucial because:

    • Entering during distribution (late stage) is high risk
    • Entering during accumulation (early stage) offers better R:R
    • You can anticipate manipulation phases
    • You know when to expect new HTF candle formation

    Complete Visual Context

    The three reference lines system provides unmatched clarity:

    • See exactly where the HTF period started
    • Understand how far price has travelled
    • Identify key institutional levels
    • Spot accumulation and distribution zones instantly

    Professional-Grade Implementation

    • Clean, non-cluttering single candle display
    • Pixel-perfect positioning that doesn't interfere with price action
    • Proper error handling (validates HTF > Chart TF)
    • Resource-efficient code
    • Compatible with all MT5 builds

    Use Cases

    Scalping & Day Trading

    • Use M15 or H1 HTF on M1/M5 charts
    • Enter during accumulation, exit before distribution
    • Use countdown to time precise entries

    Swing Trading

    • Use H4 or D1 HTF on H1/H4 charts
    • Identify larger institutional cycles
    • Avoid late entries by monitoring phase and countdown

    Multi-Timeframe Analysis

    • Stack multiple instances with different HTF settings
    • Monitor H1, H4, and D1 simultaneously on M15 chart
    • Align entries with multiple HTF cycles

    Backtesting & Study

    • Use MT5 Strategy Tester replay mode
    • Study historical PO3 patterns
    • Understand how institutions moved price
    • Perfect for ICT Mentorship students

      Tips for Best Results

      • Match HTF to your trading style: Scalpers use H1/H4, Swing traders use D1/W1
      • Use phase analysis: Only enter during accumulation phase for best R:R
      • Watch the countdown: Avoid entries when fewer than 30% of candles remain
      • Combine with other ICT concepts: Order blocks, Fair Value Gaps, Liquidity pools
      • Study in replay mode: Best way to learn PO3 patterns

      Support & Updates

      This indicator is designed for serious ICT traders who understand institutional price delivery. The phase analysis and countdown features make it an indispensable tool for timing entries within the Power of Three framework.

      Disclaimer: This indicator is for educational purposes. Always practice proper risk management and never risk more than you can afford to lose.

      おすすめのプロダクト
      TITAN AI Volume Profile PRO MT4 is an advanced technical indicator designed for professional market analysis, volume profile distribution, and graphical data visualization in MetaTrader 4. Key Features: - Dynamic Volume Profile calculation based on price action and tick volume. - Automatic High Value Area (VAH), Low Value Area (VAL), and Point of Control (POC) detection. - High Volume Nodes (HVN) and Low Volume Nodes (LVN) highlighting. - Integrated Economic Calendar with news alerts. - Built-
      The "MR Volume Profile 4" indicator is a charting tool that displays trading volume at different price levels rather than time intervals. A key concept in volume profile is the point of control (POC)—the price level with the highest volume traded during the session or time range. While tools like VWAP or OBV provide volume trends, the "MR Volume Profile 4" indicator offers granular detail about where the most market activity occurs at specific price levels. This makes it a more precise tool for
      Deep Insight Candles is an indicator that brings an entirely new perspective to the price chart. It focuses on revealing hidden structures in market movements, uncovering buyer and seller pressure, thus helping traders to better identify key levels, dynamics, and potential reversals. The indicator conveys deeper market insights, allowing traders to make decisions based on a more accurate perception of market sentiment and pressure at specific price levels. This innovative approach transforms the
      NO REPAINT The system combines several analytical techniques and presents BUY/SELL signals in an easy-to-read form. You don’t have to be a professional to use it. Aggressive TP SL can make amazingly accurate market predictions by constantly auto-analyzing every price movement, trading patterns and with the help of complex trading algorithms. This  indicator main task is to look for gravity zones and generate buy/sell signal with exact SL and TPs location.     When specified conditions are fulfi
      Volume Delta Scanner MT4
      Mariusz Franciszek Szczepanczyk
      ボリュームデルタスキャナーMT4 Volume Delta Scannerは、MetaTrader 4用のリアルタイム市場スキャンインジケーターで、単一のパネルから複数の銘柄と時間枠を同時に監視します。チャートを手動で切り替える代わりに、ウォッチリスト全体の買い圧力と売り圧力を一目で把握できます。 このインジケーターはボリュームデルタロジックに基づいて構築されています。ローソク足の構造とティックボリュームに基づいて買い圧力と売り圧力の差を計算し、監視対象として選択したすべてのシンボルと時間枠における市場の支配力を直接的かつフィルターなしで表示します。 パネルに表示される内容 パネルには、シンボルが一覧表示された見やすい表が表示されます。各行には、シンボル名、2つのシグナル列、5つの時間枠列が含まれます。 各セルは、次の3つの状態のうちの1つを示します。 緑の三角形 ― 買い圧力が優勢 赤い三角形 — 売り圧力が優勢 — 中立ダッシュ — 明確な優位性はなく、市場は均衡している Mコラム ― 市場バイアスフィルター M列は、金や主要金融商品における長年の実取引経験に基
      Was: $249  Now: $99   Market Profile defines a number of day types that can help the trader to determine market behaviour. A key feature is the Value Area, representing the range of price action where 70% of trading took place. Understanding the Value Area can give traders valuable insight into market direction and establish the higher odds trade. It is an excellent addition to any system you may be using. Blahtech Limited presents their Market Profile indicator for the MetaTrader community. Ins
      Hedge Trading Monitor is my indicator that instantly monitors the difference or ratio between two assets useful for hedge trading. How to use it + Download the indicator + Apply the indicator on an open chart + You can change the assets using the settings. Distribution + It is distributed only on MQL5.vom + Free license (FREE) - Contact me privately on MQL5.com: send me a message
      FREE
      Scalping Snake Proは、トレーダーに価格逆転の瞬間を示し、再描画しないユニークなスキャルピングインジケーターです。このインジケーターは、インターネット上の他の多くのインジケーターとは異なり、その値を再描画しません。それはあなたが取引を開くのに遅れないことを可能にする最初のバーにシグナルを描きます。このインジケーターは、シグナルが表示されたときに電話と電子メールでトレーダーに通知を送信します。このすべての機能をたったの147ドルで手に入れることができます。 この指標と取引する方法は? H1タイムフレームを開きます。通貨ペアGBPUSDまたはEURUSD。インジケーターが青い線を引く最初のバーを待っています。 TakeProfitを購入して+20ポイントを設定する取引を開始します。 StopLossは反対方向のシグナル、つまり赤い線になります。売り取引を開始するには、インジケーターが赤い線を引く最初のバーを待ちます。その後、販売取引を開始します。利益を20ポイント獲得します。 StopLossは反対方向、つまり青い線の信号になります。 このインジケーターは再描画されてい
      Separated tick volume moving averages: This tool makes it is easier to track the volume behind the moves. It will separate tick volume into bullish and bearish volumes with two separate moving averages. Tracking volume versus price in an easy way is now accessable to any trader. It will put you on track with the market makers and those who move the price. Volume is not the only thing which moves the price but its an important factor behind it. Hence it has a predictive power. How tick volume w
      A tall upper shadow occurs when the price moves during the period, but goes back down, which is a bearish signal. A tall lower shadow forms when bears push the price down, but bulls pull it back up, which leaves a long line or shadow. This is considered a bullish signal. Some technical analysts believe a tall or long shadow means the stock will turn or reverse. Some believe a short or lower shadow means a price rise is coming. In other words, a tall upper shadow means a downturn is coming, while

      This indicator displays the histogram and arrows on chart. When Simple The Best Pro are placed on a chart, they identify the trend.  The color of may be blue or red. The blue color stands for upside moves and the red color stands for downside trends. The indicator offers to set Stop Loss (SL) and  Take Profit (TP)  setting. The default value is ATR. Indicator has automatic optimization. The STB is a unique indicator that shows the tendency (button Bars) of a particular signals. The STB tells us
      This indicator incorporates built-in volume statistics, identifying true liquidity zones based on real-time trading volume and comparing it to the volume of the last 500 candlesticks. Based on the identified results, liquidity zones are plotted on the chart, indicating potential price swings. We typically identify key liquidity zones that have not yet been breached in larger timeframes, then look for suitable entry opportunities in smaller timeframes. When the price touches a key liquidity zone
      VPO Profile MT4
      Kyra Nickaline Watson-gordon
      5 (2)
      Definition : VPO is a Volume Price Opportunity. Instead of using bars or candles with an Open, High, Low, and Close price, each "bar" in a Market Profile is represented by horizontal bars against the price It is called Market Profile terminology. In other words volume-price-opportunity (VPO) profiles are histograms of how many volumes were traded at each price within the span of the profile. By using a VPO chart, you are able to analyze the amount of trading activity, based on volume, for each

      Volume Profile は、プロや機関投資家が使用する最も強力な分析ツールの1つです。画面の下部に取引が行われた時期のみを表示する従来のボリュームインジケーターとは異なり、Volume Profile はそれらの取引がどの価格レベルで行われたかを正確に表示します。これにより、市場構造の明確なX線ビジョンが得られ、スマートマネー (smart money) や機関投資家がどこでポジションを蓄積または分配しているかを正確に確認できます。 Volume Profile が機関投資家の注文と Support/Resistance を検出する方法 このインジケーターは、価格スケールに対してボリュームを水平にプロットすることで、実際の過去のトランザクションに基づいて真の需要と供給のゾーンを自然に明らかにします。標準的な Volume Profile のルールに基づいて、市場を読み取る方法は次のとおりです。 Point of Control (POC): これは、選択した期間内で最も取引量が多い特定の価格レベルです。POC は、買い手と売り手の両方が受け入れた最も公正な価格を表します。機関投資
      Volume Profile Sniper v11.1は、包括的な市場分析ツールです 取引への専門的なアプローチ ボリュームプロファイルスナイパー v11.1は、市場状況の包括的な評価に基づいて明確な信号を提供し、一つの指標に15以上の主要なフィルタを組み合わせ 主な特長 ボリューム不均衡分析-アルゴリズムは、各キャンドルの買い手と売り手のシェアを計算し、当事者の1つの優位性を通知します(50%から90%までの設定可能なしきい値)。 マルチレベル信号フィルタリング-インジケータは考慮されます: トレンド指標(9/21) 買われ過ぎ/売られ過ぎゾーンを除くRSI キャンドルパターン(ピンバー、吸収、ハンマー) サポート/抵抗レベル(自動検出) 主要なプレーヤーの活動を識別するためのボリュームスパイク クラシックと増幅されたRSIの相違 ボラティリティ評価のためのATR 傾向の強さを決定するためのADX 価格アクション(内部バーと外部バー) 複数の時間枠の確認 市場構造(高値/安値) セッションフィルタ(アジア、ロンドン、ニューヨークセッション) ニュースの
      Concept of  Market Profile  was created at Chicago Board of Trade (CBOT) by trader   Peter Steidlmayer  and first published during the 1980s as CBOT product. Market profile by itself is not a stand-alone strategy, but a different way how you can view the market and make better trading decisions. They have seen a market as an auction process which is affected by supply and demand the same way as every other auction, for example, development of prices of food, gas etc. The price goes up as long th

      Volume indicator Effect Volume , in the Forex market volumes are unique (tick). This volume indicator demonstrates the level of financial and emotional involvement. When the indicator forms a new top, it indicates that buyers are stronger than sellers over a certain period of time. If the indicator decreases, this indicates that the bears are stronger. Why is it impossible to track normal volumes in Forex? The fact is that this is an over-the-counter market. Consequently, it is practically imp
      Power Index Fx is a new generation indicator that allows an intelligent multi Timeframe analysis. The indicator is flexible and completely customizable. Its positioning in separate window makes it unobtrusive and extremely functional. Its formula of calculation makes it a fundamental tool for identifying possible moments of continuation in favor of Trend. Power Index Fx is a professional tool able to increase your operational potential. Input Values DASHBOARD SETTINGS How many symbols to show 2
      Matrix is a Forex arrow indicator. Displays signals simply and clearly! The arrows show the direction of the transaction, and are colored accordingly, which can be seen in the screenshots. As you can see, trading with such an indicator is easy. I waited for an arrow to appear in the desired direction - I opened a deal. An arrow formed in the opposite direction - closed the deal. The indicator also displays the lines with the help of which the arrow signals are formed, taking into account the int
      Let us introduce you to a new era of neural indicators for financial markets! Intelligent Moving is a unique indicator that trains its neural network in real time! You no longer need to look for the optimal indicator parameters for each specific situation. No more late signals. The artificial intelligence is able to adapt itself and predict any market movements. Visually, the indicator is drawn as a main solid moving average line, two dotted lines of standard deviations and signal arrows. For
      This multicurrency indicator is the Lite version of the Cosmic Diviner Reversal Zone Pro indicator. The indicator is based on original formulas for analyzing the volatility and price movement strength. This allows determining the overbought and oversold states of instruments with great flexibility, as well as setting custom levels for opening buy or sell orders when the overbought or oversold values of the instruments reach a user-defined percentage. A huge advantage of Reversal Zone Lite is the
      HIZOA Volume Reversal Flow Volume Pressure, Reversal Development and Directional Confirmation HIZOA Volume Reversal Flow is an analytical volume oscillator designed to visualise bullish and bearish pressure, identify developing volume reversals and reduce distracting counter-flow noise during clearer directional conditions. Instead of treating every opposing volume bar as equally meaningful, the indicator evaluates volume intensity, directional flow, price behaviour and multi-stage follow-thr
      Paid release: Delta Volume Profile Zones MT4 is a paid MetaCoderStore indicator. Use the product comments for setup questions, feature requests, and feedback for future updates. Delta Volume Profile Zones is a compact volume-profile indicator for traders who want price-level context without turning the chart into a crowded footprint screen. It builds a rolling profile from recent candles and marks the key zones traders usually watch: Point of Control, Value Area High, Value Area Low, high-volume
      Naked Forex Big Shadow IndicatorBig Shadow Indicator is a pattern recognition indicator for Forex, Stocks, Indices, Futures, Commodities and Cryptos. When you have a Big Shadow on your chart then this is a strong signal meaning that you might be ahead of a reversal. You can take other elements (momentum, trend, volatility, price action, fundamentals) to build a complete strategy and confirm your entries. Beware that you might not make money just following the arrows generated by the pattern reco
      IceFX VelocityMeter Mini is a very unique indicator on MetaTrader 4 platform which measures the speed of the Forex market . It is not a normal volume or other measurement indicator because IceFX VelocityMeter Mini is capable to understand market speed movements which are hidden in ticks and those valuable information cannot be read in an ordinary way from the candles. The software monitors the received ticks (frequency, magnitude of change) within a specified time range, analyzes these info and
      The indicator allows you to trade binary options. The recommended time frame is М1 and the expiration time is 1,2,3 minutes. The indicator suitable for auto and manual trading. A possible signal is specified as a arrows above/under a candle. You should wait until the candle closes! Arrows are not re-painted Trade sessions: TOKYO section (Half-end) Currency pairs: USD/JPY Working time frame: M1 Expiration time: 1,2,3 minutes. The indicator also shows good results when using the martingale strateg
      FREE
      これは、キャンドルの終値を予測する指標です。 このインジケータは、主にD1チャートでの使用を目的としていますが. この指標は、従来の外国為替取引とバイナリオプション取引の両方に適しています。 インジケーターは、スタンドアロンのトレーディングシステムとして使用することも、既存のトレーディングシステムへの追加として機能させることもできます。 このインジケーターは、現在のキャンドルを分析し、キャンドル自体の内部の特定の強度係数と、前のキャンドルのパラメーターを計算します。 したがって、この指標は、市場の動きのさらなる方向性と現在のキャンドルの終値を予測します。 この方法のおかげで、この指標は、短期の日中取引だけでなく、中期および長期の取引にも適しています。 インジケーターを使用すると、市場の状況の分析中にインジケーターが生成する潜在的な信号の数を設定できます。 インジケーターの設定には、このための特別なパラメーターがあります。 また、インジケーターは、チャート上のメッセージの形式で、電子メールで、およびPUSH通知の形式で、新しい信号について通知することができます。 購入後は必ず私に書いて
      Quantum Tick Volumes Indicator
      QUANTUM TRADING SOFTWARE LIMITED
      5 (1)
      Many Forex traders assume there is no volume in the foreign exchange market. And they would be correct. There is no central exchange, not yet anyway. And even if there were, what would it report? What there is however is activity, and this is captured as tick volume. After all, volume is simply displaying activity, the buyers and sellers in the market. So for volume read activity, and for activity read volume – simple. The MT4 platform delivers tick data which the Quantum Tick Volumes indicator
      Koala Supply Demand
      Ashkan Hazegh Nikrou
      4.33 (6)
      Koala Supply Demand のご紹介 ( 他のトレーダーがあなたの経験から学べるよう、良いレビューでも悪いレビューでも、ぜひフィードバックを共有してください。)  Koala Supply Demand インジケーターへようこそ。このインジケーターは、異なる時間足における 未ブレイクの供給・需要ゾーン を識別するために設計されています。このインジケーターは、トレーダーが市場をゾーンエリアとして視覚的に把握するのに役立ちます。価格が強力なゾーンをどのように尊重しているかを見ることができ、またゾーン内部で形成された場合にはプライスアクションシグナルも表示します。 Supply Demand コンセプト についてさらに学ぶ : 記事 さらに多くの無料製品を入手 するために私の MQL5 チャンネルへ参加してください : 参加 Koala Supply Demand の MT5 バージョン も利用可能です : ダウンロード 主な特徴: チャート上バックテスト機能: 独自の On Chart Back Test 機能により、分析の未来を体験してください。チャート上の任意の場所をクリ
      FREE
      Discount: It will be $39 for 2 purchases!  Contact me  to send you instruction and add you in group. QM (Quasimodo) Pattern is based on Read The Market(RTM) concepts. The purpose of this model is to face the big players of the market (financial institutions and banks), As you know in financial markets, big traders try to fool small traders, but RTM prevent traders from getting trapped. This style is formed in terms of price candles and presented according to market supply and demand areas and
      このプロダクトを購入した人は以下も購入しています
      Trend SniperX MT4
      Sarvarbek Abduvoxobov
      5 (3)
      Trend Sniper X は、トレーダーがトレンドの方向性と潜在的な反転ポイントを明確かつ正確に特定できるように設計された、MetaTrader 5 用のマルチタイムフレーム・トレンドフォロー指標です。 MT5版はこちら: https://www.mql5.com/en/market/product/181101 価格情報: 現在の価格はプロモーション価格であり、今後のアップデートや新機能の追加に伴い変更される場合があります。 Code2Profit チャンネル マルチタイムフレーム分析で市場をマスターしよう! Trend Sniper Xで勝率を最大化する方法:ルールとセッションのコツ 技術仕様 プラットフォーム MetaTrader 5 インジケータータイプ マルチタイムフレーム・トレンドインジケーター 動作タイムフレーム すべてのチャート時間足(上位足M1~MN1を独立して選択可能) 主要対象銘柄 為替(Forex)、ゴールド(XAUUSD)、その他のCFD 推奨口座 すべての口座タイプ ビジュアル表示 トレンドカラーローソク足(買い/売り/弱い/変化)+ 買い/売りシグナル
      Miraculous Indicator Binary & Forex v3 StrategySafe Miraculous Indicator Binary & Forex v3 StrategySafe は、明確なシグナル、強力な確認ツール、そして Binary と Forex 市場で使える体系的な取引アプローチを求めるトレーダー向けのプロフェッショナル指標です。 v3 では、MIR Dashboard、Miraculous Confirmation Dashboard、GANN Law、Square of 9 レベル、GANN 角度、そしてより高度な Forex モードが搭載されています。 主な特徴 Binary と Forex の両方に対応。 MIR Dashboard による素早い市場分析。 Miraculous Confirmation Dashboard によるエントリー確認。 Forex 分析用の GANN Law drawing lines。 Square of 9 のライン、レベル、方向表示。 1x1 GANN Angle によるトレンド圧力の確認。 Entry I
      SR Liquidity は、市場の流動性が集中し、価格が最も強く反応する「隠れたゾーン」を可視化するために設計されたトレーディング指標です。こうした流動性の高いエリアは強力なサポート(支持)およびレジスタンス(抵抗)レベルとして機能し、市場が反転する可能性が最も高いポイントを明確に示してくれます。 単なる一般的なサポートラインやレジスタンスラインを描画するのではなく、「SR Liquidity」は実際の価格変動を分析し、売りと買いの圧力が集中するゾーンを特定します。これらは、市場の真の動きを牽引する「流動性のプール(溜まり場)」そのものです。それらをチャート上に直接可視化することで、価格が実際に反応する前に、その動きを予測することが可能になります。つまり、このインジケーターは価格の方向性が変わる可能性を予測するのです。生のプライスアクションを、市場の重要な水準(転換点となり得るポイント)を示す、明確で実用的なロードマップへと変換してくれます。 このインジケーターは、FX、株価指数、貴金属、仮想通貨など、あらゆる銘柄や時間足で使用可能です。 ご購入後、取引手順や無料の優れた追加インジケ
      Gann Made Easy は、ミスター・ギャンの理論を使用した取引の最良の原則に基づいた、プロフェッショナルで使いやすい外国為替取引システムです。 W・D・ガン。このインジケーターは、ストップロスとテイクプロフィットレベルを含む正確な買いと売りのシグナルを提供します。 PUSH通知を利用して外出先でも取引可能です。 ご購入後、取引方法の説明と優れた追加インジケーターを無料で入手するには、私にご連絡ください! おそらく、ギャンの取引手法についてはすでに何度も聞いたことがあるでしょう。通常、ギャンの理論は初心者のトレーダーだけでなく、すでにある程度の取引経験がある人にとっても非常に複雑なものです。なぜなら、ギャンの取引手法は理論的にはそれほど簡単に適用できるものではないからです。私はその知識を磨き、最良の原則を私の外国為替インジケーターに組み込むために数年を費やしました。 このインジケーターは非常に簡単に適用できます。必要なのは、それをチャートに添付し、簡単な取引推奨事項に従うだけです。このインジケーターは常に市場分析の仕事を行い、取引の機会を探します。適切なエントリーポイントを検出す
      プレシジョン・インデックス・オシレーター(Pi-Osc)は、Precision Trading SystemsのRoger Medcalfによるものです。 バージョン2は、チャートにスーパーファストでロードされるように注意深く再コードされ、その他の技術的な改良も組み込まれて、エクスペリエンスを向上させています。 Pi-Oscは、市場が強制的に行かなければならない、すべての人のストップを取り除くためのポイントである、極限のエクソースト・ポイントを見つけるために設計された正確な取引タイミング信号を提供するために作成されました。 この製品は、極限のポイントがどこにあるかを知るという古代の問題を解決し、トレーダーの生活をはるかにシンプルにします。 これは、業界標準のオシレーターとは異なる強力な要素を持つ高度なコンセンサス・インジケーターです。 使用されている一部の機能には、需要指数、マネーフロー、RSI、スティリング、パターン認識、出来高分析、標準偏差の極値などがあり、異なる長さでこれらのバリエーションが多く含まれています。 初めて見ると、訓練されていない目には、他のオシレーター
      DayTrader PRO MT5:  https://www.mql5.com/en/market/product/186222 DayTrader PROは、ジョン・エリュース(John Ehlers)のラグuerreフィルターと強力な自動最適化エンジンを組み合わせた、高度なトレーディング・インジケーターです。固定されたパラメーターを使用するのではなく、直近の市場状況に基づいて最適な設定を自動的に検索するため、手動による絶え間ない調整をすることなく、変化する市場のボラティリティに適応できます。 本インジケーターは、明確な「買い(BUY)」および「売り(SELL)」シグナルを生成し、現在の市場ボラティリティから算出された適応型のストップロス(Stop Loss)およびテイクプロフィット(Take Profit)レベルを表示します。トレンド、効率レシオ(Efficiency Ratio)、ボラティリティ、およびローソク足フィルターが内蔵されており、精度の低いセットアップを排除し、シグナルの精度を向上させます。 リアルタイム・パフォーマンスパネルには、現在最適化されている設定、プロフィッ
      通貨強さウィザードは、取引を成功させるためのオールインワン ソリューションを提供する非常に強力な指標です。このインジケーターは、複数の時間枠のすべての通貨のデータを使用して、このまたはその外国為替ペアのパワーを計算します。このデータは、使いやすい通貨インデックスと通貨パワーラインの形式で表され、特定の通貨のパワーを確認するために使用できます。 必要なのは、取引したいチャートにインジケーターを接続することだけです。インジケーターは、取引する通貨の実際の強さを示します。このインジケーターは、トレンドに合わせて取引するときに有利に利用できる売買高の圧力の極値も示します。このインジケーターには、フィボナッチに基づく可能なターゲットも表示されます。 このインジケーターは、PUSH 通知を含むあらゆるタイプのアラートを提供します。 購入後ご連絡下さい。私の取引のヒントをあなたと共有し、素晴らしいボーナスインジケーターを無料で提供します! 幸せで有益な取引をお祈りします。
      M1 Sniper
      Oleg Rodin
      4.97 (30)
      M1 SNIPER は使いやすいトレーディングインジケーターシステムです。M1時間足向けに設計された矢印インジケーターです。M1時間足でのスキャルピングのためのスタンドアロンシステムとして、また既存のトレーディングシステムの一部としても使用できます。このトレーディングシステムはM1時間足での取引に特化して設計されていますが、他の時間足でも使用できます。元々、この手法はXAUUSDとBTCUSDの取引用に設計しましたが、他の市場においても役立つと考えています。 インジケーターのシグナルは、トレンドの方向と逆方向に取引できます。インジケーターのシグナルを利用して両方向に取引するのに役立つ特別な取引テクニックをご紹介します。この手法は、特別な動的なサポートとレジスタンスの価格帯を利用することに基づいています。 ご購入後、M1 SNIPER矢印インジケーターをすぐにダウンロードできます。さらに、M1 SNIPERツールのすべてのユーザーに、以下のスクリーンショットに表示されているApollo Dynamic SRインジケーターを無料で提供しています。この2つのインジケーターを組み合わせることで
      PRO Renko Systemは、特別にRENKOチャートを取引するために設計された高精度の取引システムです。 これは、様々な取引商品に適用することができる普遍的なシステムです。 システムは効果的に正確な逆転信号へのアクセスを与えるいわゆる市場の騒音を中和する。 表示器は非常に使いやすく、信号の生成に責任がある1つの変数だけがあります。 あなたは簡単にお好みの任意の取引ツールとレンコバーのサイズにツールを適応させることができます。 私はいつもあなたが私のソフトウェアで収益性の高い取引を支援するために余分なサポートを提供する準備ができています! 私はあなたに幸せで収益性の高い取引をしたいです! ご購入後にご連絡ください! 私はあなたに私のレンコチャートジェネレータを送信します。 私はまた、私の個人的な推奨事項やシステムの他のモジュールを無料で共有します!
      これはMT4のインジケーターで、再描画なしで取引に参入するための正確なシグナルを提供します。 外国為替、暗号通貨、金属、株式、インデックスなど、あらゆる金融資産に適用できます。かなり正確な見積もりを提供し、取引を開始して終了するのに最適な時期を教えてくれます。1つのシグナルを処理しただけでインジケーターの元が取れた例の 動画 (6:22)をご覧ください。Entry PointsPro インジケーターの助けを借りたほとんどのトレーダーの最初の1週間の結果が改善しています。 Telegramグループ に登録してください。Entry Points Proインジケーターのメリットは次の通りです。 再描画のないエントリーシグナル 再描画されるインジケーターでは一度表示されたシグナルが削除されて大きな金銭的損失につながることがありますが、これと異なり、表示されて確認されたシグナルは消えることがありません。 エラーなしの取引開始 インジケーターアルゴリズムによって取引を開始する(資産を売買する)理想的な瞬間を見つけることができます。それを使用するすべてのトレーダーの成功率が向上します。 あら
      スイングトレーディング は、トレンドの方向のスイングと可能な反転スイングを検出するように設計された最初のインジケーターです。トレーディングの文献で広く説明されているベースラインスイングトレーディングアプローチを使用します。インディケータは、いくつかの価格と時間のベクトルを調査して、全体的なトレンドの方向を追跡し、市場が売られ過ぎまたは買われ過ぎて修正の準備ができている状況を検出します。 [ インストールガイド | 更新ガイド | トラブルシューティング | よくある質問 | すべての製品 ] むち打ちを起こさずに市場スイングの利益 インジケーターは常にトレンドの方向を表示します 色付きの価格帯は機会のベースラインを表します 色付きのダッシュは、可能な反転スイングを表します この指標は、独自の品質とパフォーマンスを分析します 複数時間枠のダッシュボードを実装します カスタマイズ可能なトレンドおよびスイング期間 電子メール/サウンド/プッシュアラートを実装します インジケータは再描画またはバックペインティングではありません Swing Tradingとは Swing Tradingは
      この製品は 2026 年の市場向けに更新され、最新の MT5 ビルドに最適化されています。 価格更新のお知らせ: Smart Trend Trading System は現在 $99 で提供されています。 次の 30 件の購入 後、価格は $199 に上がります。 特別オファー: Smart Trend Trading System を購入後、私にプライベートメッセージを送ることで、 Smart Universal EA を無料 で受け取り、Smart Trend のシグナルを自動売買に変えることができます。 Smart Trend Trading System は、リペイントなし、再描画なし、遅延なしの完全なトレーディングシステムです。よりクリーンなシグナル、より明確なトレンド方向、そしてより整理された取引方法を求めるトレーダー向けに作られています。 Online course , manual and [download presets] . このシステムは、トレンド検出、反転ゾーン、Smart Cloud、トレーリングストップロジック、サポートとレジスタンス、ローソク足の色分け
      TPA True Price Action indicator reveals the true price action of the market makers through 100% non-repainting signals (except early signals mode) strictly at the close of a candle! TPA shows entries and re-entries, every time the bulls are definitely stronger than the bears and vice versa. Not to confuse with red/green candles. The shift of power gets confirmed at the earliest stage and is ONE exit strategy of several. There are available now two free parts of the TPA User Guide for our custom
      Quantum Naked SMC Prime is a streamlined Smart Money Concepts indicator designed for traders who prefer a clean chart, structured market analysis and clear visual trade setups without unnecessary complexity. The indicator combines market structure, liquidity behavior, institutional zones and confirmation logic into a compact analytical framework. Instead of flooding the chart with technical indicators, Quantum Naked SMC Prime focuses on the core elements of price action and Smart Money Concepts.
      現在40%オフ! 初心者やエキスパートトレーダーに最適なソリューション! このインジケータは、独自の機能と秘密の数式を組み込んだ、ユニークで高品質かつ手頃な価格のトレーディングツールです。たった1枚のチャートで28の通貨ペアのアラートを表示します。新しいトレンドやスキャルピングチャンスの引き金となるポイントを正確に把握することができるので、あなたのトレードがどのように改善されるか想像してみてください! 新しい基本的なアルゴリズムに基づいて構築されているため、潜在的な取引の特定と確認がより簡単になります。これは、通貨の強さや弱さが加速しているかどうかをグラフィカルに表示し、その加速のスピードを測定するためです。加速すると物事は明らかに速く進みますが、これはFX市場でも同じです。つまり、反対方向に加速している通貨をペアにすれば、利益を生む可能性のある取引を特定することができるのです。 通貨の勢いを示す縦の線と矢印は、あなたの取引の指針となるでしょう。 ダイナミックマーケットフィボナッチ23レベルはアラートトリガーとして使用され、市場の動きに適応します。もしインパルスが黄色のトリガ
      KURAMA GOLD SIGNAL PRO MT4版 ゴールドのサインに、目で見えるトレード計画を。 ゴールドのサインが出た。利確はどこか。損切りはどこか。エントリー前に何を確認すべきか。 KURAMA GOLD SIGNAL PROは、その判断材料をチャートに集約します。XAUUSDのM5、M15向けに、売買サイン、自動計算TP/SL、3段階のサイン評価、注意すべき相場条件を知らせるMARKETパネルを搭載。 セットアップ、決済目安、相場の注意点を一か所で確認。情報を集める手間を減らし、トレードの判断に集中できます。 買い切り購入者限定特典 AI Zone Radar MT5版と完全PDFマニュアルを無料プレゼント。 ご購入後にMQL5でメッセージをお送りください。買い切り購入が対象です。レンタルは対象外です。 AI Zone Radarを見る サインから、具体的なトレード計画へ SMA 13、21、75、100へのタッチを使ったセットアップを検出。各サインに売買方向と対象MAを表示するため、浅い押し目、戻りと深い調整を区別して確認できます。 チャートとパネルには、次の情報を表示し
      ご紹介     Quantum Breakout PRO は 、ブレイクアウト ゾーンの取引方法を変革する画期的な MQL5 インジケーターです。 13年以上の取引経験を持つ経験豊富なトレーダーのチームによって開発された Quantum Breakout PROは 、革新的でダイナミックなブレイクアウトゾーン戦略により、あなたの取引の旅を新たな高みに押し上げるように設計されています。 クォンタム ブレイクアウト インジケーターは、5 つの利益ターゲット ゾーンを備えたブレイクアウト ゾーン上のシグナル矢印と、ブレイクアウト ボックスに基づいたストップロスの提案を提供します。 初心者トレーダーにもプロのトレーダーにも適しています。 量子EAチャネル:       ここをクリック MT5バージョン:   ここをクリック 重要!購入後、インストールマニュアルを受け取るためにプライベートメッセージを送ってください。 推奨事項: 時間枠: M15 通貨ペア: GBPJPY、EURJPY、USDJPY、NZDUSD、XAUUSD アカウントの種類: ECN、Raw、またはスプレッドが非
      ARTEMIS サブウィンドウ・リバーサル・システム は、リペイントなしの強力な外国為替インジケーターであり、Smart Money Concepts(スマートマネー概念)とストキャスティクスのモメンタム分析を組み合わせて、高確率の反転トレードを特定するために設計されています。 精度の高いエントリーを求めるトレーダー向けに開発されており、流動性スイープの検出、マーケット構造の変化、モメンタム確認を一つのシンプルでプロフェッショナルなツールに統合しています。 このインジケーターが優れている理由 多くのインジケーターはランダムなシグナルを出しますが、 ARTEMISは実際の市場の動きに注目します: 流動性スイープ(ストップ狩り)の検出 チャージ・オブ・キャラクター(ChoCH)の確認 KとDのクロスによるタイミング判断 明確なBuy/Sell矢印 リペイントなしのロジック設計 これにより、無駄なシグナルが減り、高品質なトレードセットアップが増えます。 完璧なBUYシグナルシステム(最大の強み) このインジケーターは特に買いエントリーで強力です: ステップ1:弱気モメンタムの減少 ストキャス
      Introducing the POWER TRADE Indicator Created by a small group of experienced traders with years of profitable experience in the financial markets, the Power Trade Indicator is a plug-and-play trading tool designed to help traders spot high-quality setups with ease and confidence. What It Does: It provides powerful entry signals, profit-taking zones, and rebound areas — giving you a complete view of where price action is most likely to move next. The indicator reacts in real time, al
      Dark Support Resistance  is an Indicator for intraday trading. This Indicator is programmed to identify  Support and Resistance Lines , providing a high level of accuracy and reliability. Key benefits Easily visible lines Only the most important levels will be displayed Automated adjustment for each timeframe and instrument Easy to use even for beginners Never repaints, never backpaints, Not Lag 100% compatible with Expert Advisor development All types of alerts available: Pop-up, Email, Push
      ボリューム ブレイク オシレーターは、オシレーターの形で価格変動とボリューム トレンドを一致させるインジケーターです。 私はボリューム分析を戦略に統合したいと思っていましたが、OBV、マネー フロー インデックス、A/D、ボリューム加重 Macd など、ほとんどのボリューム インジケーターにいつもがっかりしていました。 そのため、このインジケーターを自分で作成し、その有用性に満足したので、市場に公開することにしました。 主な機能: ボリュームの増加 (ブレイク) によってサポートされる方向に価格が動くフェーズを強調します。 ボリュームの増加が止まり、市場が縮小するフェーズを強調します。 特に時間枠 (<=15 分) のデイトレードでは、価格もボリュームも動かないため、市場が将来の動きに備えられるフェーズを強調します。 ボリュームの増加によってサポートされていない場合、他のエキスパート アドバイザーからの誤ったシグナルをフィルターします。 トレンドとレンジ フェーズを非常に簡単に視覚化できます 入力パラメーター: 計算設定: 計算タイプ: FAST、NORMAL、SLOW。同じ
      Scalper Inside PRO は日中トレンドの分析を助け、エントリー前にトレードを組み立てられるインジケーターです。中核となるのは、相場をより正確に読むための3つの専用ストラテジー。シグナルが出た瞬間に方向を自動で判断し、主要な価格帯を計算するので、想定エントリーポイント、予想ストップロス、複数の利確レベルを前もって確認できます。詳細なパフォーマンス統計が、各銘柄とストラテジーが過去にどう機能したかを示し、今の相場に合った資産選びを助けます。単体のスキャルピングツールとしても、あなたのシステムの一部としても、自作 EA のベースとしても使えます。MetaTrader 4 プラットフォームで動作します。 インジケーターはエントリー、3つの利確レベル - TP1、TP2、TP3、そして任意のストップロスをチャート上に直接表示します。自作の矢印インジケーターを接続し、その統計と収益性を検証することも可能です。 ご購入後は直接ご連絡ください。専用のボーナス add-ons、実トレードでの活用に関する追加情報、そしてご自身のトレードシステムや EA への正しい接続のサポートをお渡しします
      トレンドトレーディング は、タイミングのプルバックとブレイクアウトにより、市場で起こっているトレンドから可能な限り利益を得るように設計された指標です。確立されたトレンドの中で価格が何をしているかを分析することにより、取引の機会を見つけます。 [ インストールガイド | 更新ガイド | トラブルシューティング | よくある質問 | すべての製品 ] 自信を持って効率的に金融市場を取引する むち打ちにならずに確立されたトレンドから利益を得る 収益性の高いプルバック、ブレイクアウト、早期の逆転を認識する この指標は、独自の品質とパフォーマンスを分析します 複数時間枠のダッシュボードを実装します インジケーターは再描画されていません 電子メール/音声/視覚アラートを実装します 確立されたトレンドは多くの取引機会を提供しますが、ほとんどのトレンド指標はそれらを完全に無視しています。インジケーターの解釈はかなり簡単です: (1) トレンドの変化 (2) トレンドの方向への後退 (3) トレンドの方向へのブレイクアウト 赤いダッシュ は下降トレンド中の修正です 青いダッシュ は上昇トレンド中
      Prop Firm Sniper MT4  is a professional market structure indicator that automatically identifies high-probability BUY and SELL opportunities using BOS and CHoCH analysis. Recommended Timeframes: For backtesting, use the indicator on   M5 or M15   for Gold (XAUUSD), and   M15 or H1   for more volatile Forex pairs such as   GBPUSD, USDJPY, EURGBP , and similar markets. CONTACT ME AFTER PURCHASE TO CLAIM YOUR FREE BONUSES! Prop Firm Sniper  is a professional market structure indicator designed t
      Prophet is a trend indicator. Shows the direction of turning points. Can be used with an optimal risk-to-profit ratio. The arrows indicate favorable moments and directions for entering the market. Uses one parameter for setting (adjust from 1 to 3). The probability of a successful trend is very high. In the course of work, the take-profit is much larger than the stop-loss! Works on all currency pairs and on all timeframes.
      この製品は 2026 年の市場向けに更新され、最新の MT5 ビルドに最適化されています。 価格更新のお知らせ: Atomic Analyst は現在 $99 で提供されています。 次の 30 件の購入 後、価格は $199 に上がります。 特別オファー: Atomic Analyst を購入後、私にプライベートメッセージを送ることで、 Smart Universal EA を無料 で受け取り、Atomic Analyst のシグナルを自動売買に変えることができます。 Atomic Analyst は、リペイントなし、再描画なし、遅延なしの Price Action トレーディングインジケーターで、手動取引、シグナルの明確化、EA 自動化のために設計されています。 User manual: settings, inputs and strategy.     &   User Manual PDF . 価格行動、強さ、モメンタム、マルチタイムフレーム方向、高度なフィルターを分析し、トレーダーがノイズを減らし、弱いセットアップを避け、より構造化された取引判断を行えるようにします。 こ
      Introduction This indicator detects volume spread patterns for buy and sell opportunity. The patterns include demand and supply patterns. You might use each pattern for trading. However, these patterns are best used to detect the demand zone (=accumulation area) and supply zone (=distribution area). Demand pattern indicates generally potential buying opportunity. Supply pattern indicates generally potential selling opportunity. These are the underlying patterns rather than direct price action. T
      現在30%OFF! 初心者やエキスパートトレーダーのためのベストソリューション! このダッシュボードソフトウェアは、28の通貨ペアで動作しています。それは私達の主要な指標(高度な通貨の強さ28と高度な通貨インパルス)の2に基づいています。それは全体の外国為替市場の大きい概観を与えます。それは、すべての(9)時間枠で28の外国為替ペアのための高度な通貨の強さの値、通貨の動きの速度と信号を示しています。チャート上で1つのインディケータを使用して市場全体を観察し、トレンドやスキャルピングの機会をピンポイントで見つけることができたら、あなたのトレードがどのように改善されるか想像してみてください。 このインディケータには、強い通貨と弱い通貨の識別、潜在的な取引の識別と確認がより簡単になるような機能が搭載されています。このインディケータは、通貨の強さや弱さが増加しているか減少しているか、また、すべての時間枠でどのように機能しているかをグラフィカルに表示します。 新機能として、現在の市場環境の変化に適応するダイナミックなマーケットフィボナッチレベルが追加され、すでに当社のAdvanced
      This indicator Super Channel Pro Pluss indicator.Indicator displays trend movement. Indicator calculates automatically line. Features FiltPer - displays indicator channel period. deviation - displays indicator channel deviation. deviation2 - displays indicator channel deviation. deviation3 - displays indicator channel deviation. How to understand the status: If the arrow is up and line color Teal ;trend is up. If the arrow is down and line color Red; trend is down. If the arrow is Yellow close
      このインジケーターは、反転ポイントと価格戻りゾーンを正確に表示します。     主要プレーヤー 。新たなトレンドが形成される場所を把握し、最大限の精度で意思決定を行い、すべての取引をコントロールします。 TREND LINES PRO インジケーターと組み合わせることで、その潜在能力を最大限に発揮します。 VERSION MT5 インジケーターが示す内容: 新しいトレンドの始まりに活性化する反転構造と反転レベル。 リスクと報酬の比率を最小限に抑えた利益 確定 と 損失停止の レベルの表示     RR 1:2   。 インテリジェントな削減ロジックによるストップロス。 指定されたインジケーターから 2 つのトレンド タイプの反転パターンを表示します。 指標: トレンドを追う   TREND LINES PRO   (世界的なトレンドの変化) TREND PRO   (クイックトレンド変更) シンプルで効果的   スキャナー   リアルタイムトレンド(新機能)。 マルチタイムフレームのインストゥルメント フィルタリング。 画面   利益     LOGIC AI信号の後。 当日プラス方
      作者のその他のプロダクト
      Session Box Indicator for MetaTrader 5 IMPORTANT NOTE: **A new input parameter ( Skip weekends  )  has been introduced which must be set to false for markets opened 24/7** Version 1.00 Release Version 1.01 Complete code rewrite Version 1.02 Fix: added missing font name and removed emoji as session name, added label positioning Version 1.03 Fix: proper weekend handling, complete minute support for all sessions, independent label position Description: The SessionBox indicator is designed to visu
      FREE
      Session Box Indicator for MetaTrader 4 IMPORTANT NOTE: **A new input parameter ( Skip weekends  )  has been introduced which must be set to false for markets opened 24/7** Version 1.00 Release Version 1.01 Complete code rewrite Version 1.02 Fix: added missing font name and removed emoji as session name, added label positioning Version 1.03 Fix: proper weekend handling, complete minute support for all sessions, independent label position Description: The SessionBox indicator is designed to visu
      Range Bar Pro Indicator for MetaTrader 5 Visualize market trends, levels and other features with Range Bar Pro, an innovative indicator that draws a unique, standalone candle on the right side of any MT5 chart. This single candle is generated from an analysis of price over a specified range, providing you with a powerful snapshot of the market. Key Features: Single-Candle Visualization: Gain quick insights with a single, specially derived candle that reflects comprehensive price movement over a
      ADX-Based Candle Color Indicator for MT5 Description:   Enhance your trading experience with the ADX-Based Candle Color Indicator for MT5! This powerful tool colors candlesticks based on the Average Directional Index (ADX) indicator, helping you quickly assess market strength and direction at a glance. Key Features:   - Color-Coded Candles:     - Green (Bullish) when D+ > D-.     - Red (Bearish) when D- > D+.   - Intensity Mapping:       The color intensity reflects the ADX value—stronger col
      HTF Power of Three (ICT) -  MT5 Indicator - Version 1.1 Overview The HTF Power of Three indicator is a professional implementation of the Inner Circle Trader's (ICT) Power of Three concept, inspired by Larry Williams. This indicator visualizes higher timeframe (HTF) candle development in real-time on any lower timeframe chart, making it an essential tool for ICT traders who study institutional price movement patterns. What is Power of Three (PO3)? Power of Three represents a three-staged Smart M
      Footprint Indicator for MT5 1. Introduction  This Indicator provides a real-time footprint and volume profile visualization per candle directly on MetaTrader 5 charts, allowing traders to analyze order flow, volume distribution, and market pressure with precision.  2. Installation  1. Copy the Indicator file into the MetaTrader 5 /Indicators folder.  2. Restart MetaTrader 5.  3. Drag the Indicator onto a chart.  3. Indicator Overview  The Indicator renders a footprint representation for each
      In trading, the Master Pattern (sometimes called the market master pattern ) is a conceptual framework describing how price typically moves as capital flows through markets. It is not a rule-set, but a recurring structural sequence driven by institutional behaviour, liquidity, and crowd psychology. Different trading schools describe it with different names, but the underlying logic is largely the same. Core Idea Markets tend to move through a repeating cycle: Accumulation → Expansion → Distribut
      フィルタ:
      レビューなし
      レビューに返信