Simple ICT Concepts
- Indicateurs
-
Cao Minh Quang
 Welcome to my profile. I am a developer MQL4 and MQL5.
Telegram: https://t.me/storevan
Thanks and regards! - Version: 2.6
- Mise à jour: 21 août 2025
- Activations: 5
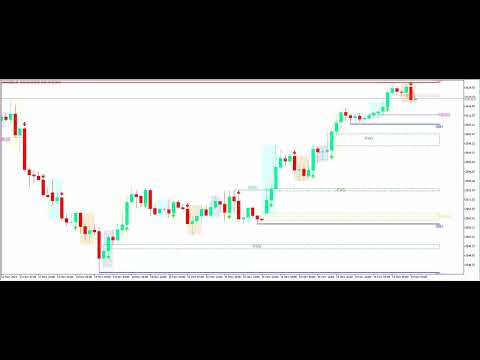
The Simple ICT Concepts Indicator is a powerful tool designed to help traders apply the principles of the Inner Circle Trader (ICT) methodology. This indicator focuses on identifying key zones such as liquidity levels, support and resistance, and market structure, making it an invaluable asset for price action and smart money concept traders.
Key Features
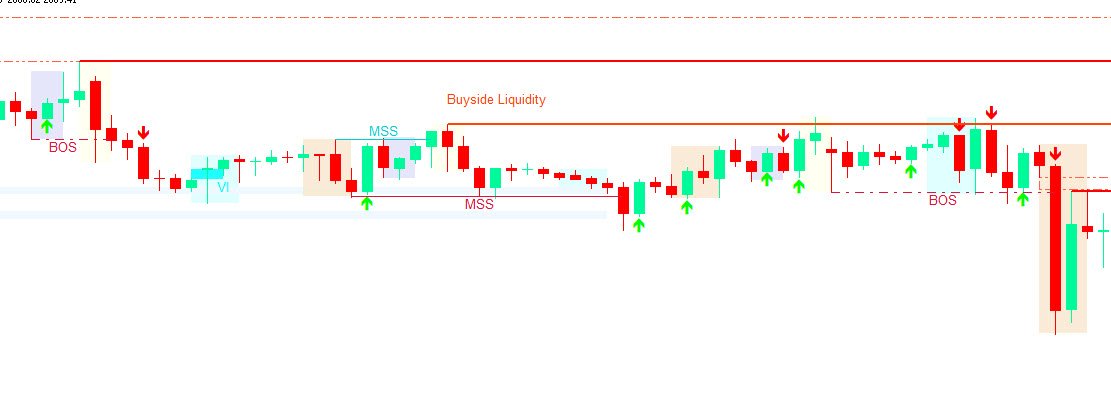
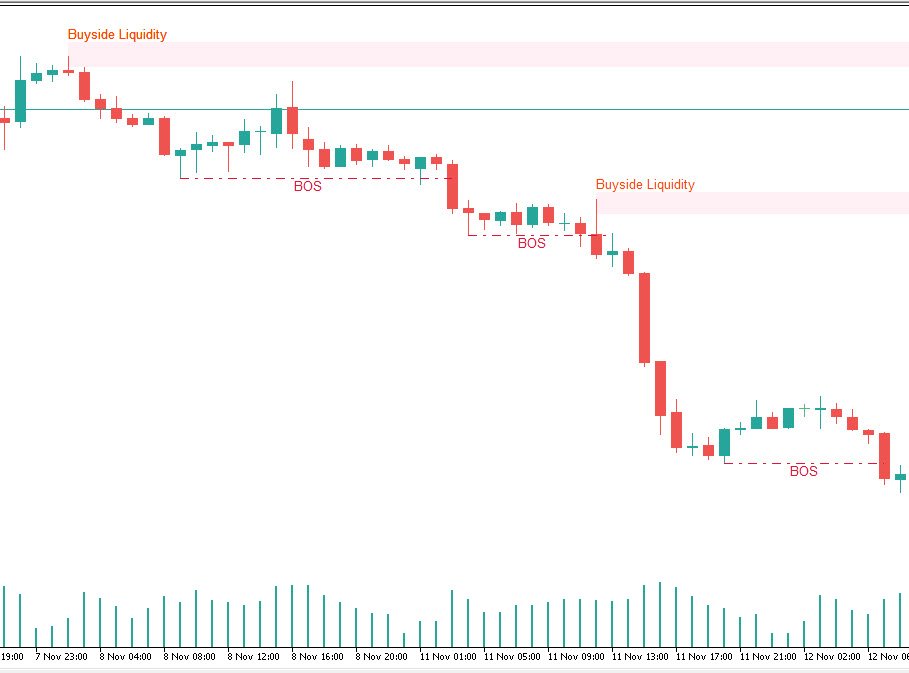
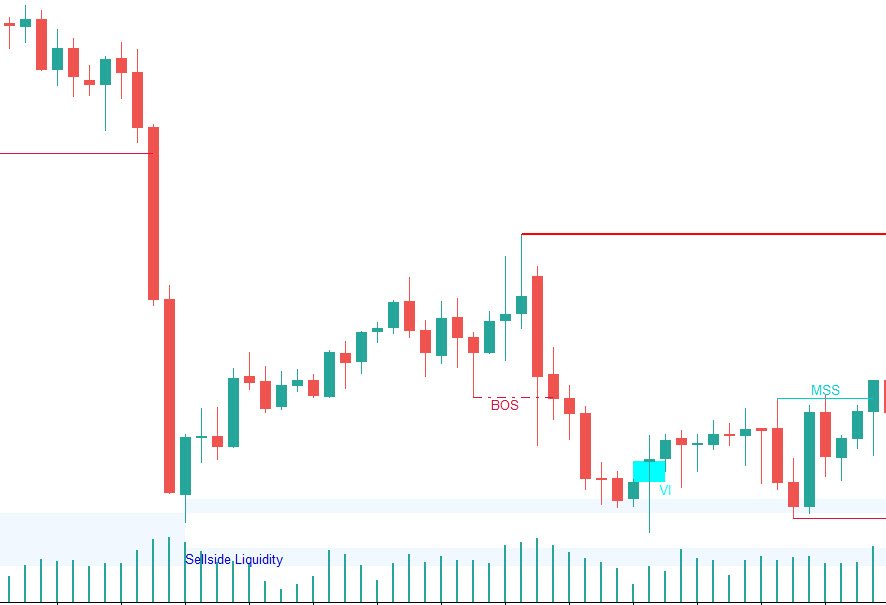
Market Structure:
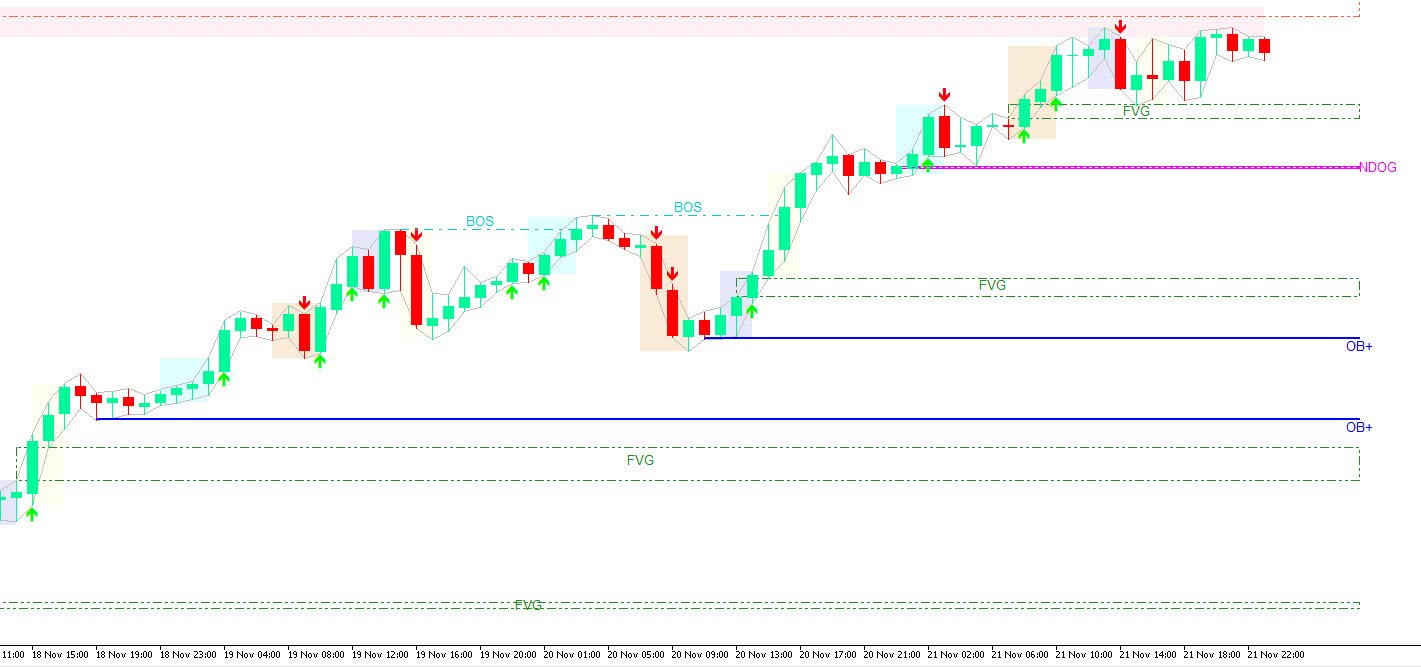
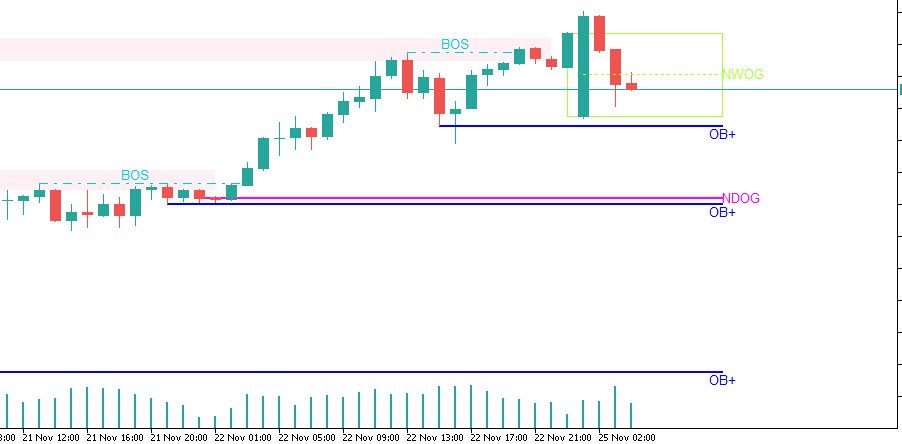
Market structure labels are constructed from price breaking a prior swing point. This allows a user to determine the current market trend based on the price action.There are two types of Market Structure labels included:Market Structure Shift (MSS)Break Of Structure (BOS)A MSS occurs when price breaks a swing low in an uptrend or a swing high in a downtrend, highlighting a potential reversal.This is often labeled as "CHoCH", but ICT specifies it as MSS. On the other hand, BOS labels occur when price breaks a swing high in an uptrend or a swing low in a downtrend.The occurrence of these particular swing points is caused by retracements (inducements) that highlights liquidity hunting in lower timeframes.Key swing points: Higher Highs (HH) and Lower Lows (LL), Higher Lows (HL) and Lower Highs (LH)Displacement:Displacements are scenarios where price forms successive candles of the same sentiment (bullish/bearish) with large bodies and short shadows.These can more technically be identified by positive auto correlation (a close to open change is more likely to be followed by a change of the same sign) as well as volatility clustering (large changes are followed by large changes).Displacements can be the cause for the formation of imbalances as well as market structure, these can be caused by the full execution of a meta order.Volume Imbalance:A Volume Imbalance (V.I.) occurs when there is an area of price that has been left without a candle body. There is up-and-down movement in the overlapping of the wicks, however since the bulk of the volume is in the body of the candle, we dub this a Volume Imbalance.Order Blocks:An ICT (Inner Circle Trader) order block is a price area on a chart where large institutional investors place significant buy or sell orders. Order blocks are a key concept in trading, as they can help traders identify potential support and resistance levels, and anticipate price reversals.Liquidity:Buy-side/Sell-side liquidity levels highlight price levels where market participants might place limit/stop orders.Buyside liquidity levels will regroup the stop-loss orders of short traders as well as limit orders of long traders, while Sell-side liquidity levels will regroup the stop-loss orders of long traders as well as limit orders of short traders.These levels can play different roles. More informed market participants might view these levels as source of liquidity, and once liquidity over a specific level is reduced it will be found in another area.FVG/IFVG:Fair Value Gaps: A three candle formation where the candle shadows adjacent to the central candle do not overlap, this highlights a gap area.Implied Fair Value Gaps: Unlike the fair value gap the implied fair value gap has candle shadows adjacent to the central candle overlapping. The gap area is constructed from the average between the respective shadow and the nearest extremity of their candle body.Balanced Price Range: Balanced price ranges occur when a fair value gap overlaps a previous fair value gap, with the overlapping area resulting in the imbalance area.NWOG/NDOG:This indicator reveals the new week opening gaps (NWOG) and new day opening gaps (NDOG). The NWOG is the gap between Friday's closing price and Sunday's opening price. The NDOG is the gap between the opening price and closing price of the previous day.Kill Zones:ICT Kill-zones are specific timeframes in the forex market that highlight increased volatility and trading volume. The four primary Kill-zones – Asian, London, New York, and London Close – each offer unique trading opportunities for various trading pairs and markets.EA Integration:Using Global Variables.Update the global variables on every bar close.Always add the lastest price value of the elements as following struct:
Order Block
(Symbol)_(Period)_(Prefix Global input)_(BULL or BEAR)_OB_TOP (Lastest OB Top price. Ex: XAUUSD_16385_CMQ_ICT_BULL_OB_TOP )(Symbol)_(Period)_(Prefix Global input)_(BULL or BEAR)_OB_BOTTOM (Lastest OB Bottom price. Ex: XAUUSD_16385_CMQ_ICT_BULL_OB_BOTTOM )(Symbol)_(Period)_(Prefix Global input)_(BULL or BEAR)_OB_TIME (Lastest OB Time Created. Ex: XAUUSD_16385_CMQ_ICT_BULL_OB_TIME )(Symbol)_(Period)_(Prefix Global input)_(BULL or BEAR)_OB_TOUCHED_TIME (Lastest OB First touched time. Ex: XAUUSD_16385_CMQ_ICT_BULL_OB_TOUCHED_TIME)
Fair value gaps
(Symbol)_(Period)_(Prefix Global input)_(BULL or BEAR)_FVG_TOP (Lastest FVG Top price. Ex: XAUUSD_16385_CMQ_ICT_BULL_FVG_TOP )(Symbol)_(Period)_(Prefix Global input)_(BULL or BEAR)_FVG_BOTTOM (Lastest FVG Bottom price. Ex: XAUUSD_16385_CMQ_ICT_BULL_FVG_ BOTTOM )(Symbol)_(Period)_(Prefix Global input)_(BULL or BEAR)_FVG_MID (Lastest FVG Middle price. Ex: XAUUSD_16385_CMQ_ICT_BULL_FVG_MID )(Symbol)_(Period)_(Prefix Global input)_(BULL or BEAR)_FVG_TIME (Lastest FVG Time Created. Ex: XAUUSD_16385_CMQ_ICT_BULL_FVG_TIME )(Symbol)_(Period)_(Prefix Global input)_(BULL or BEAR)_FVG_TOUCHED_TIME (Lastest FVG First touched time. Ex: XAUUSD_16385_CMQ_ICT_BULL_FVG_TOUCHED_TIME)
BOS/MSS
(Symbol)_(Period)_(Prefix Global input)_(BULL or BEAR)_MSS (Lastest MSS price. Ex: XAUUSD_16385_CMQ_ICT_BULL_MSS)(Symbol)_(Period)_(Prefix Global input)_(BULL or BEAR)_MSS_TIME (Lastest MSS Time Created. Ex: XAUUSD_16385_CMQ_ICT_BULL_MSS_TIME)(Symbol)_(Period)_(Prefix Global input)_(BULL or BEAR)_BOS (Lastest BOS price. Ex: XAUUSD_16385_CMQ_ICT_BULL_BOS)(Symbol)_(Period)_(Prefix Global input)_(BULL or BEAR)_BOS_TIME (Lastest BOS Time Created. Ex: XAUUSD_16385_CMQ_ICT_BULL_BOS_TIME)
Swing point
Customizable Features(Symbol)_(Period)_(Prefix Global input)_HH (Lastest HH price. Ex: XAUUSD_16385_CMQ_ICT_ HH) (Symbol)_(Period)_(Prefix Global input)_LH (Lastest LH price. Ex: XAUUSD_16385_CMQ_ICT_ LH) (Symbol)_(Period)_(Prefix Global input)_HL (Lastest HL price. Ex: XAUUSD_16385_CMQ_ICT_ HL) (Symbol)_(Period)_(Prefix Global input)_LL (Lastest LL price. Ex: XAUUSD_16385_CMQ_ICT_ LL)
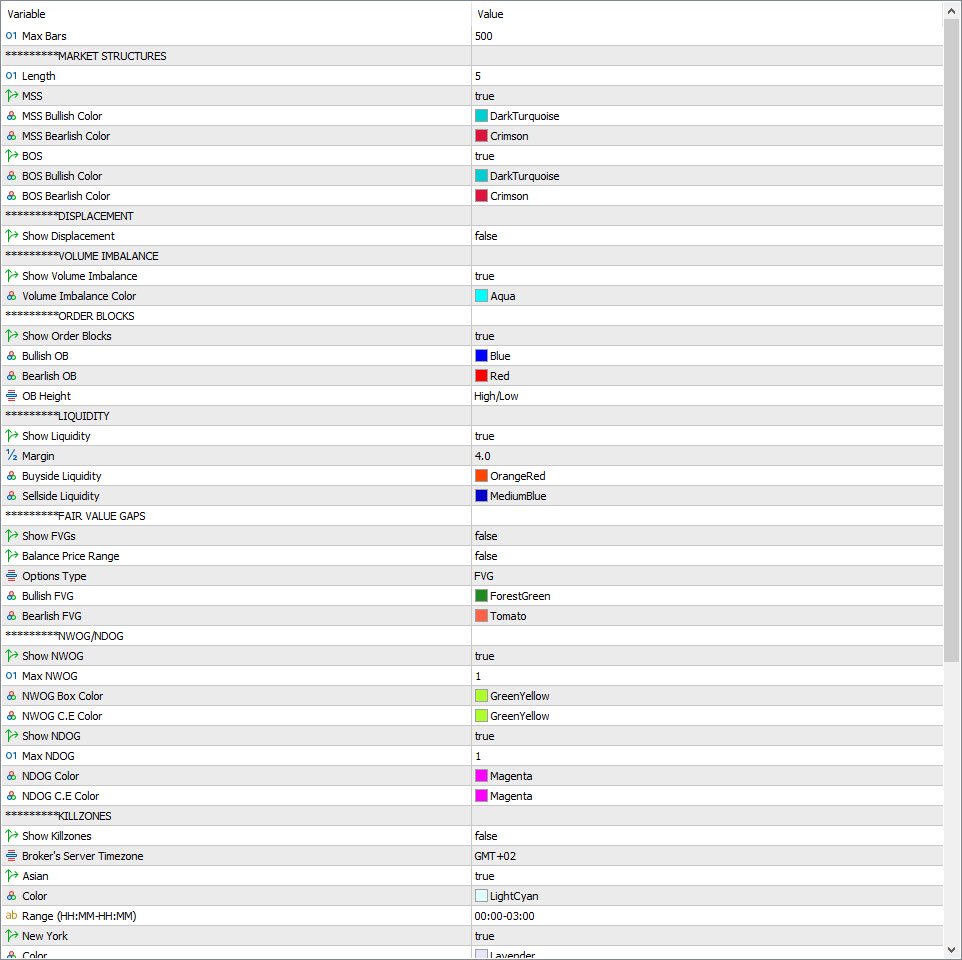
Users can adjust settings like data length, colors, and display styles to match their trading preferences.Benefits for Traders
Saves time on manual analysis, enhancing trading efficiency.Conclusion
Helps make quick and informed decisions during volatile market conditions.
Easy to use for both beginners and experienced traders.
The Simple ICT Concepts Indicator is not just a tool but a comprehensive solution for traders looking to effectively implement ICT strategies. It’s a robust choice for enhancing market analysis and executing precise trades.
I first tested this indicator to validate its accuracy and alignment with ICT concepts. After confirming its effectiveness, I purchased it because I was impressed and wanted to develop an EA using its data alongside other indicators. Initially, I faced some challenges integrating the indicator with my EA. This is where the developer, Cao, truly earned a 5-star rating. Not only did he assist with my questions, but he also made minor updates to the indicator to ensure seamless integration with EAs and compatibility with the strategy tester. Such support is not very common and greatly exceeded my expectations. I highly recommend both the indicator and the developer, Cao.