All Averages Speed

Perhaps you have previously read in technical analysis books about such a concept as "market slope", or "trend slope". Metatrader has such a tool as "trend line by angle". But when working on auto-scaled charts, this tool becomes completely abstract, and as a consequence, useless. The idea of this new parameter, included in the AllAverages_Speed indicator, is to give such a concept as "trend slope" specific numerical values, as well as the further use of the new parameter in work.    

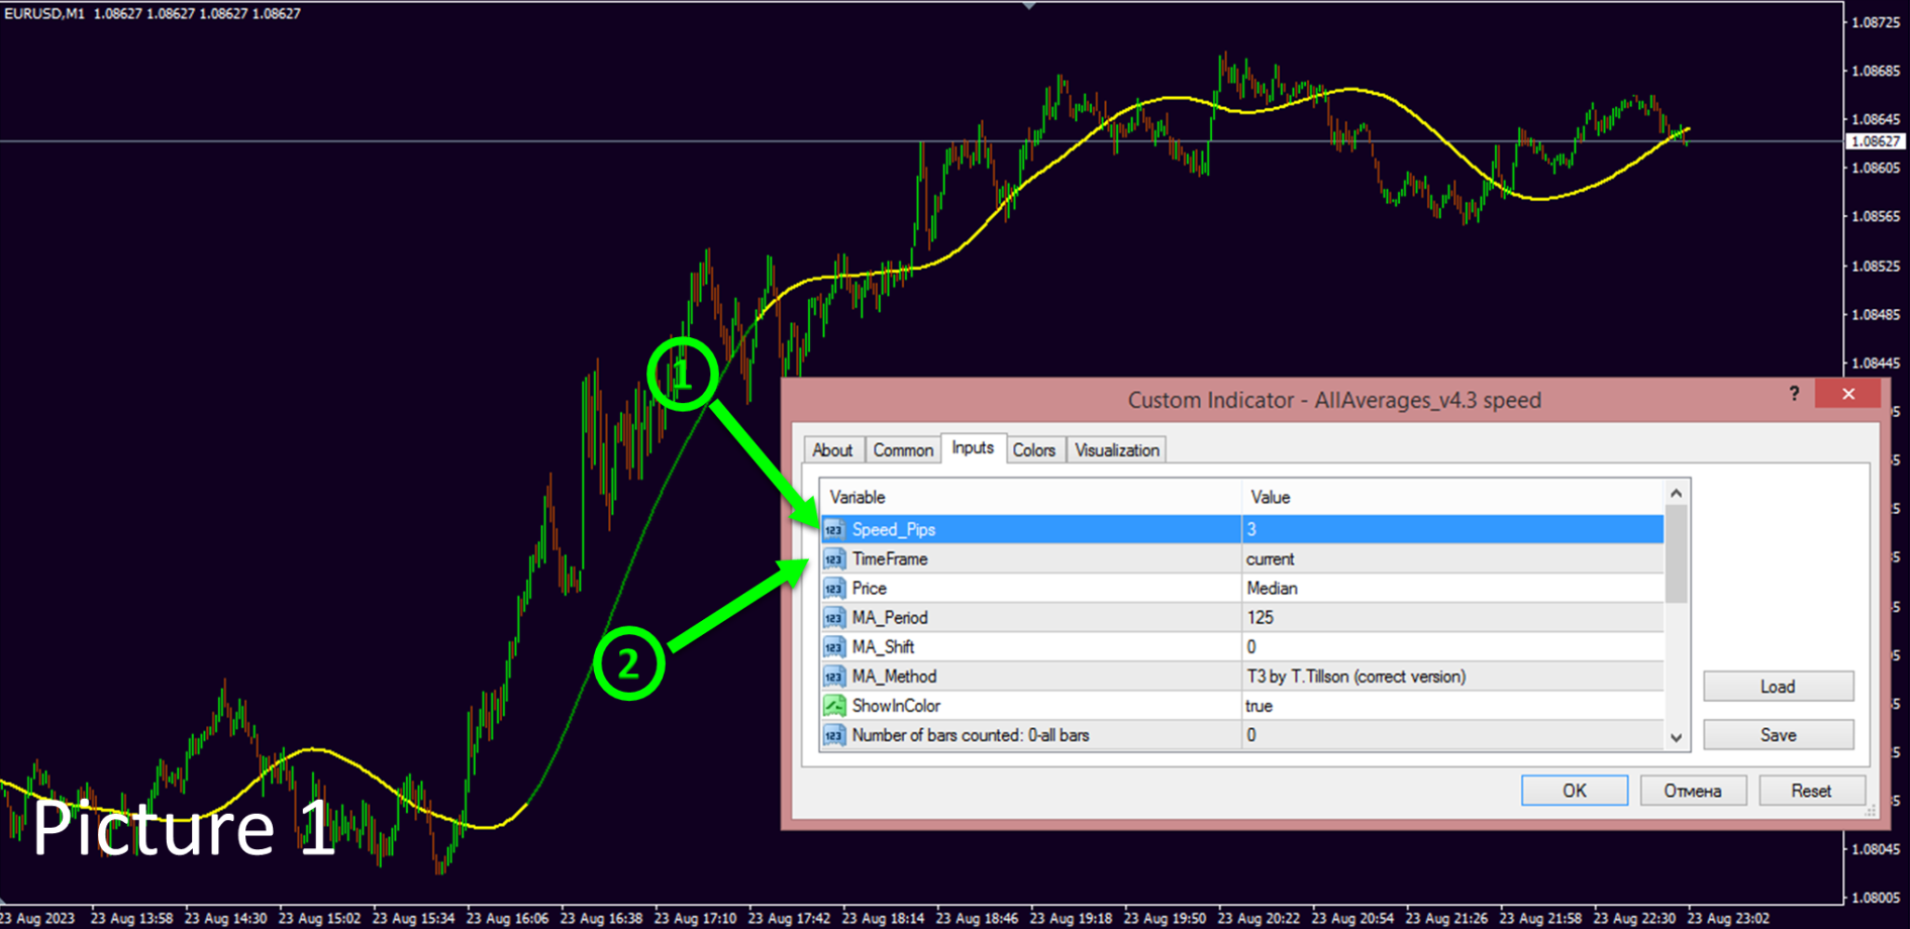
Modification of the AllAverages_Speed indicator with the addition of my own idea. Previously posted in CodeBase AllAverages v4.9 MT4 and AllAverages v4.9 MT5. The essence of the modification is to add a parameter that measures the speed of slope of the selected moving average in pips per unit of time. On Picture1 under the number <1> is the added parameter Speed pips. The unit of time is the candles of the selected timeframe, Picture 1 number <2>. Changing this parameter will change the coloring of the indicator, it will occur in those places where the speed of the slope of the moving average was higher than specified in the Speed Pips parameters. 

Usage options:

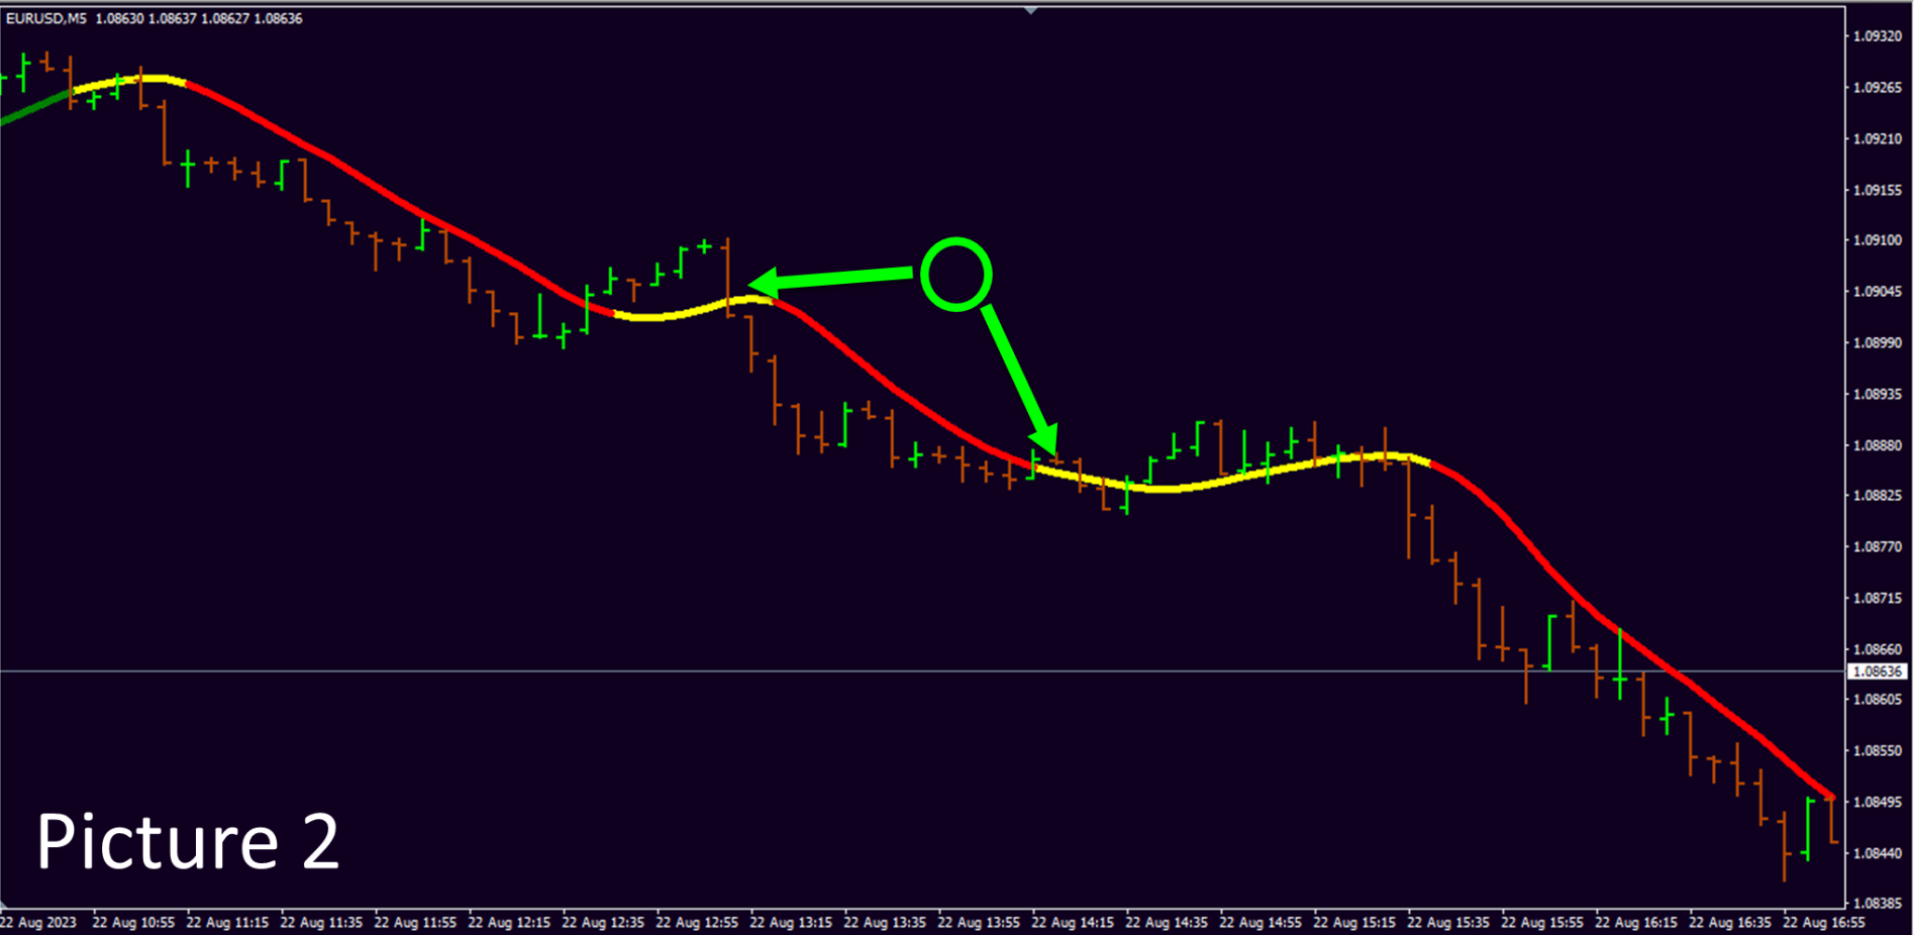
1. Flat filter. The classical definition of flat implies the absence of an obvious price movement direction. If you select Speed pips correctly, you will achieve that the indicator will be colored yellow. This is an appropriate signal to ignore the breakdowns of the moving average and wait for the price to gain sufficient speed. Picture2.

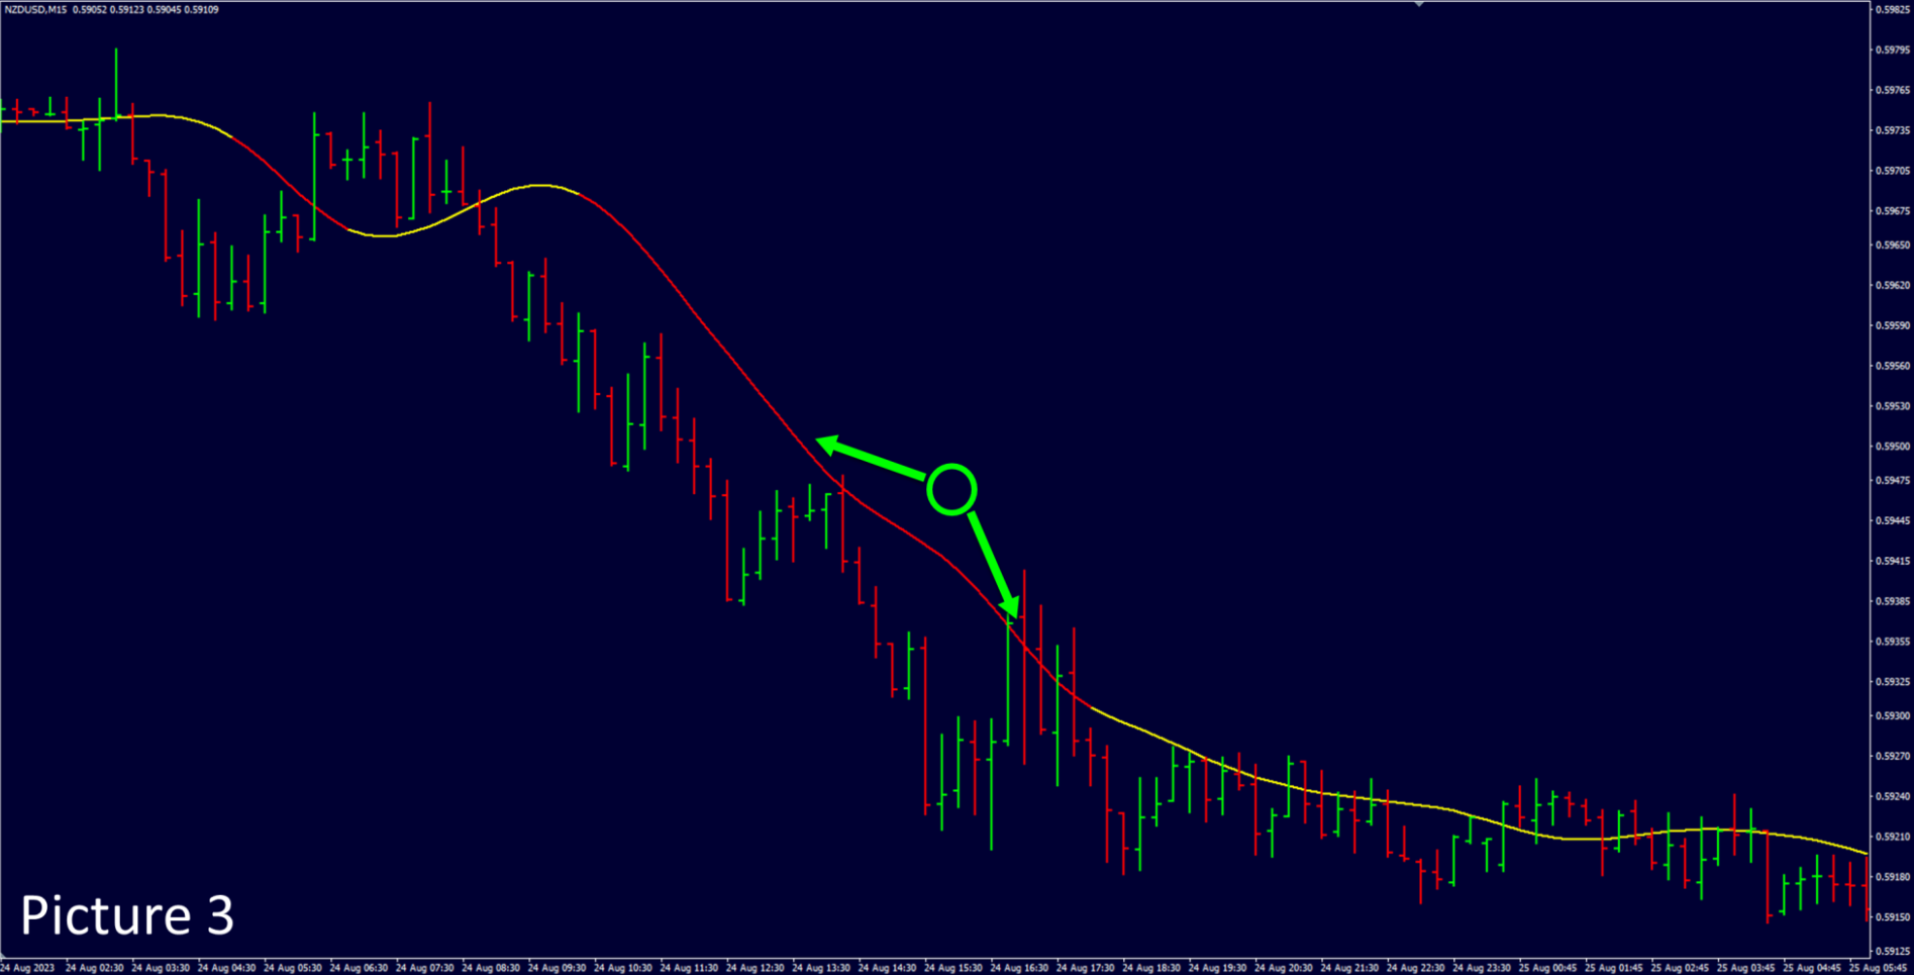
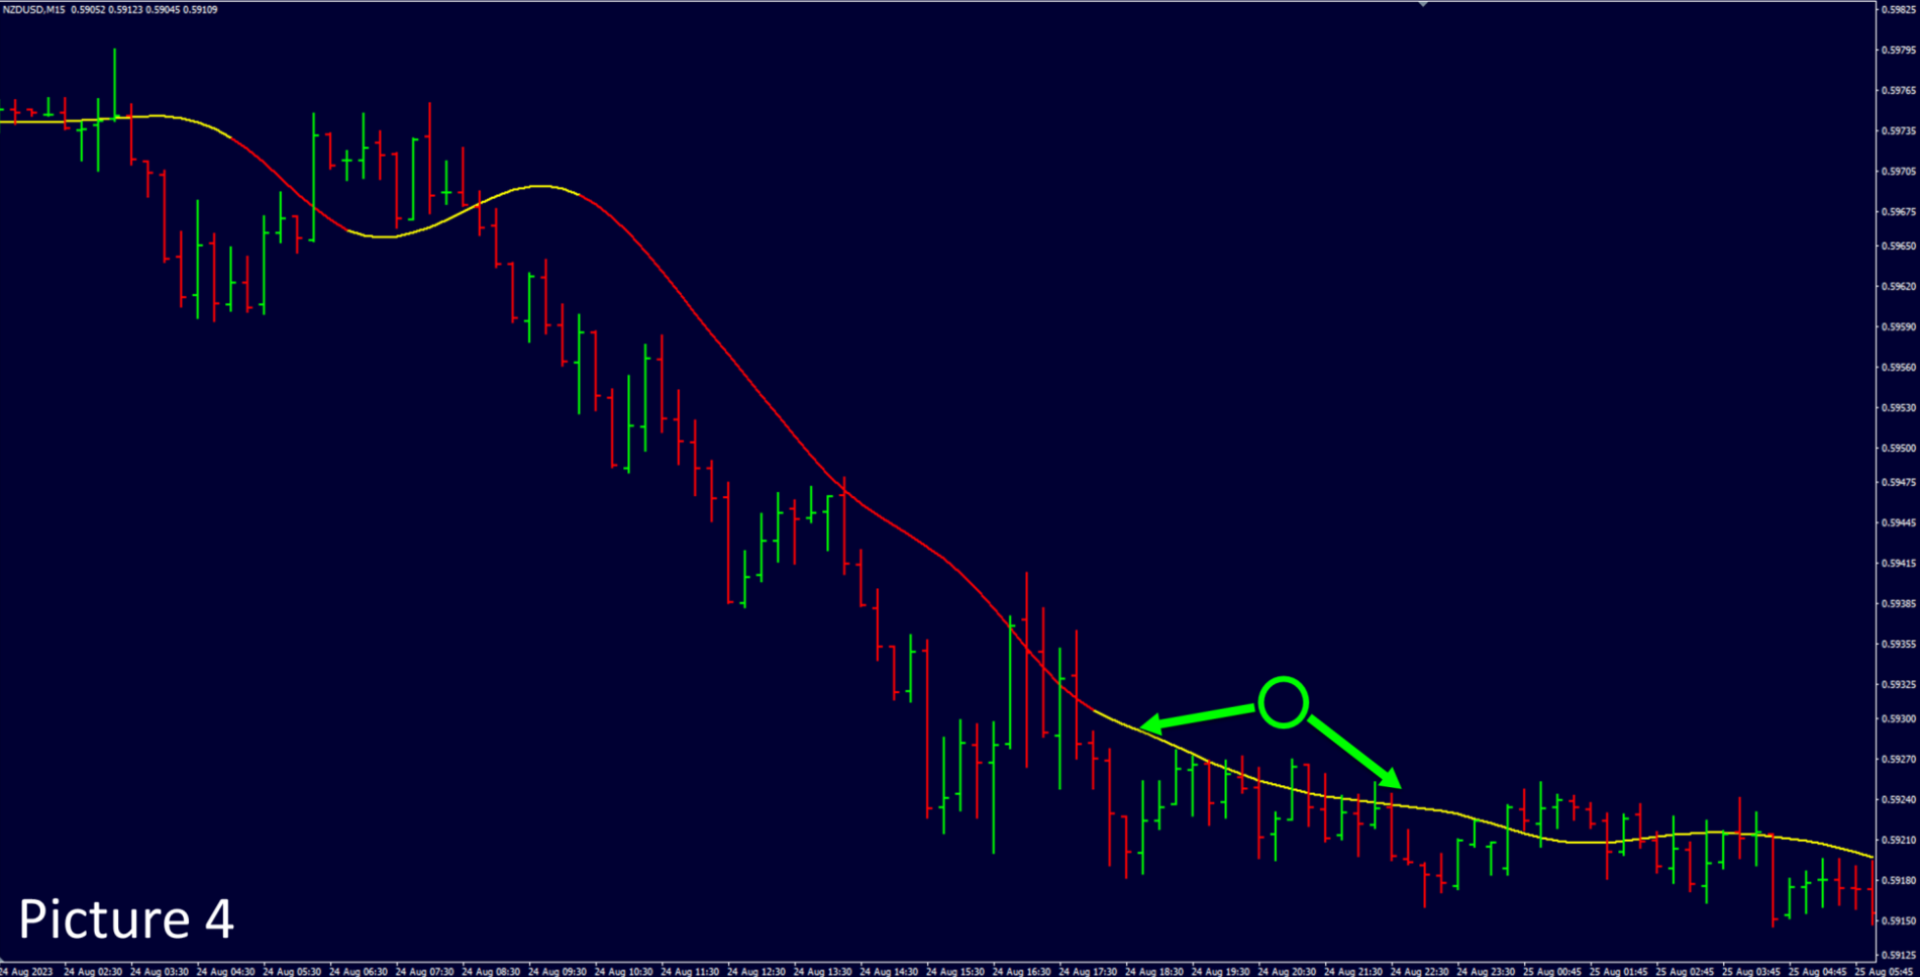
2. Trend work, filtering trends by the speed parameter. As mentioned above, the concept of "trend slope" now has a numerical value. The speed of the slope of the line, colored section of the moving average, gives a hint on keeping the speed of the price trend Picture3. Or if the trend shows signs of fading movement, as a consequence, the speed starts to decrease Picture4. So it is necessary to prepare for a reversal of the movement or prepare for a big correction.  

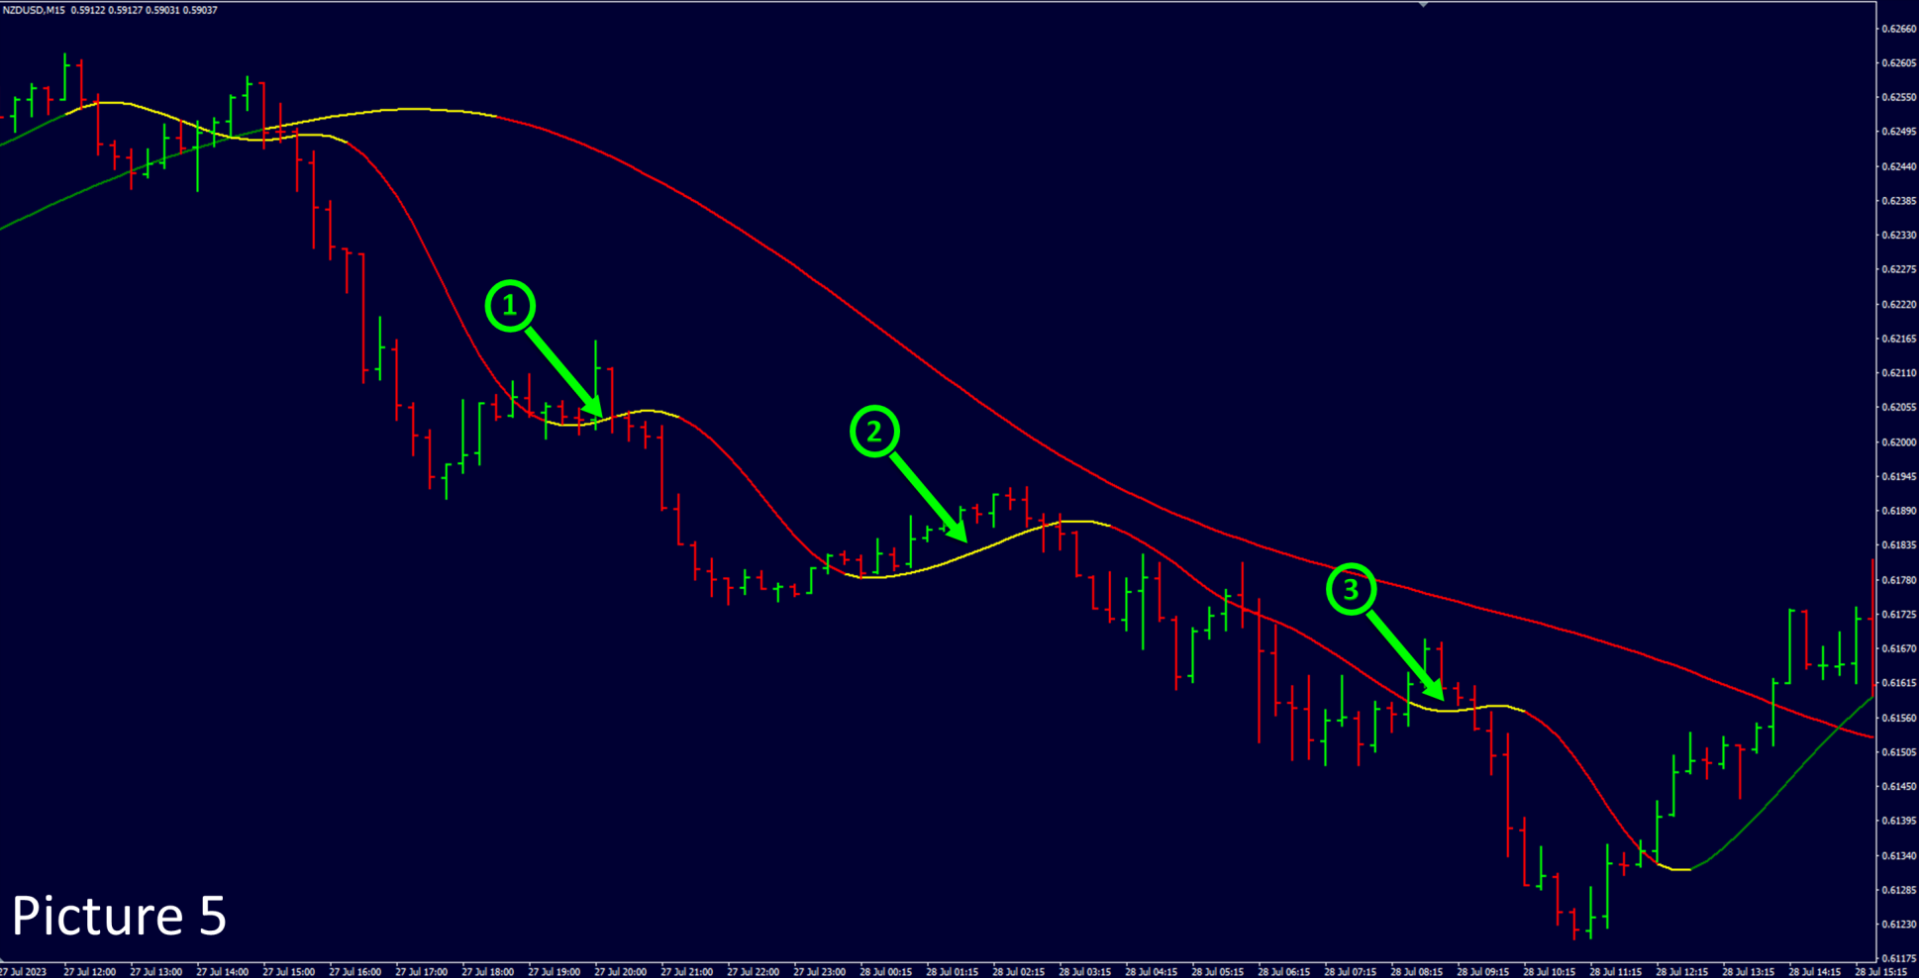
3. Classic application. Two moving averages, trading in the direction of the older moving average with a long averaging period at the moment when the younger moving average is colored yellow. Picture5. 

4. Combination with the Consolidation Box indicator. The link can be found on the main page of the profile. The moving average shows which way to trade, plus, with the new Speed Pips parameter, which shows that the "trend slope" has sufficient speed. And when a trend fade occurs, you should stop trading in that direction and concentrate on looking for reversal signals. I plan to publish examples of different settings with indicator parameters on my MQL5.com profile wall, so that you can use these examples in trading. Picture6.

Disadvantages:
All traders want to get in at the beginning of any move. The moving average has always been a lagging indicator, so no matter how much you speed it up, you still can't get an instant reaction. The speed of slope of the moving average line Speed Pips can sometimes help in analyzing market movements. But it is possible to change the approach to analyzing movements, for example, to work in those moments when the "trend slope" is preserved, in this indicator it is the Speed Pips parameter. In this case, the beginning of the trend will be missed, but the middle of the trend, while maintaining sufficient speed, will be taken by the trader to work. 

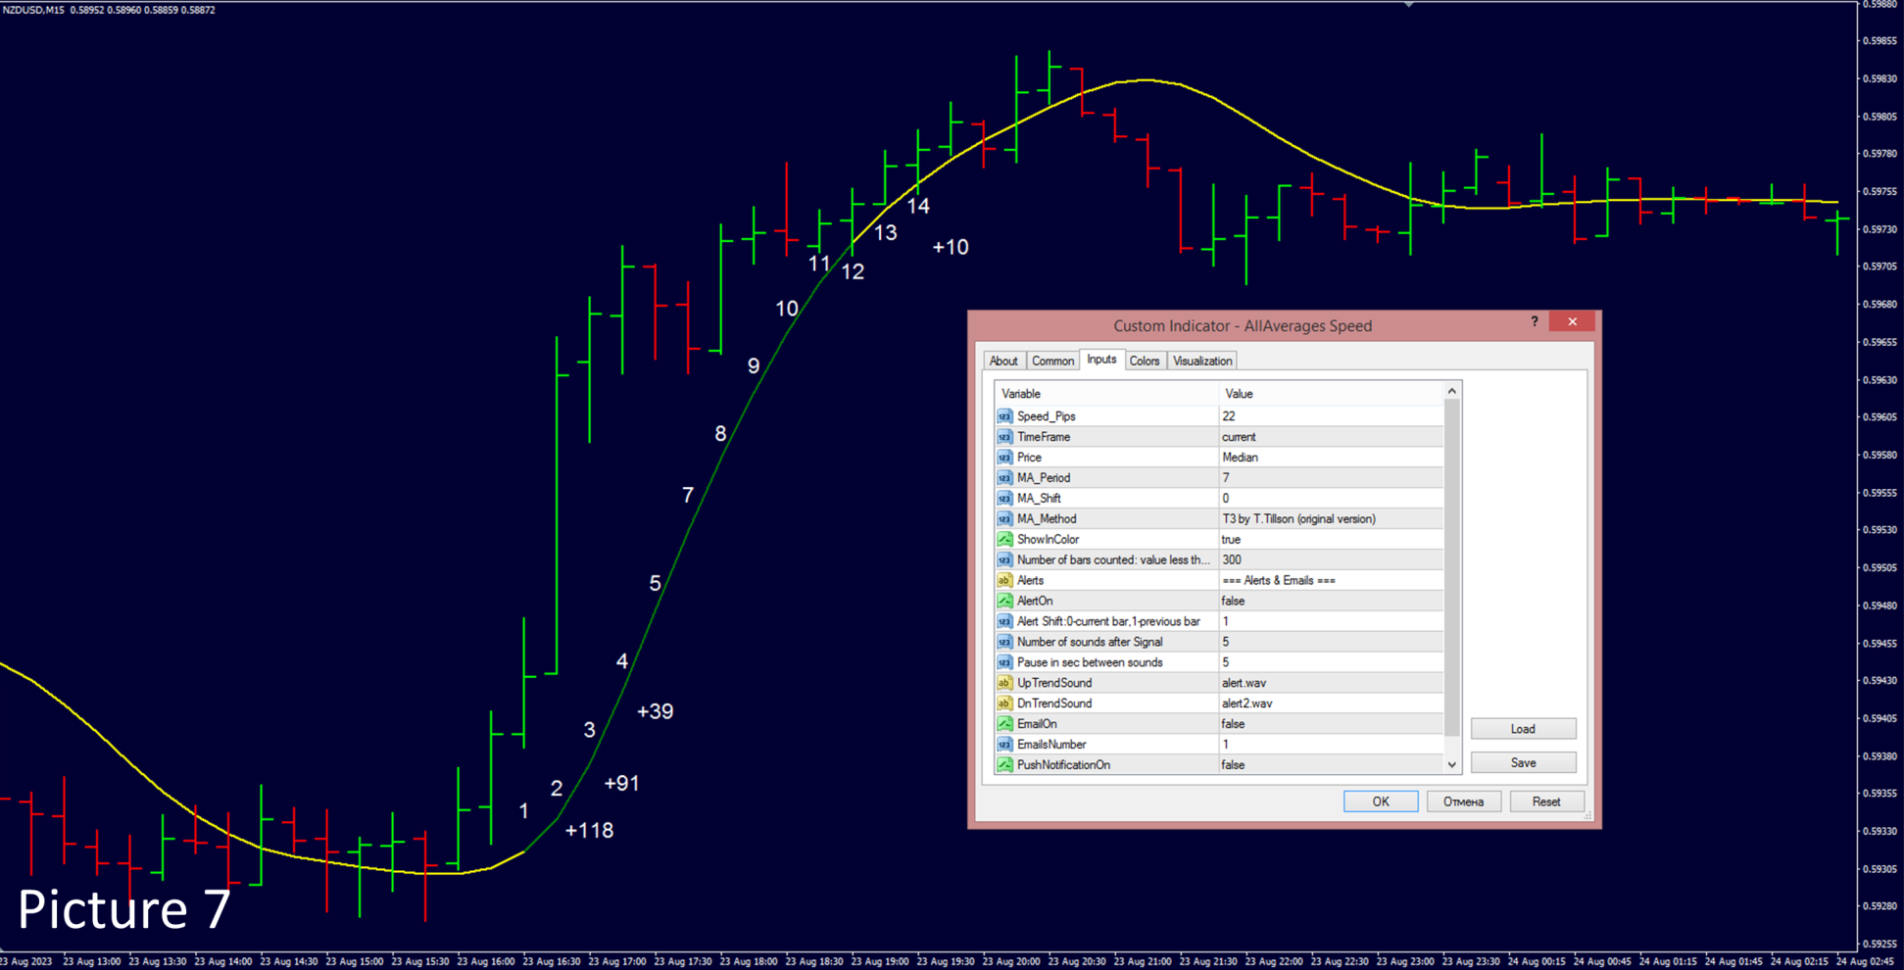
Operation of the Speed Pips parameter in detail Picture7.

To calculate how much Pips the moving average line has sloped, the indicator subtracts the previous value from the current value of the line. And as long as this value is higher than the value specified in the parameters (the moving average line retains speed, "trend slope") the indicator will be colored green when the price is rising and red when it is falling. In Picture7, the difference between the 13th point and the 14th point is only +10 pips, and in the parameters Speed Pips=22, so the indicator has become yellow.

Available Methods (MA_Method):

  1. SMA                 Simple Moving Average
  2. EMA                 Exponential Moving Average
  3. Wilder              Wilder Exponential Moving Average
  4. LWMA               Linear Weighted Moving Average
  5. SineWMA          Sine Weighted Moving Average
  6. TriMA               Triangular Moving Average
  7. LSMA                Least Square Moving Average (or EPMA, Linear Regression Line)
  8. SMMA               Smoothed Moving Average
  9. HMA                 Hull Moving Average by A.Hull
  10. ZeroLagEMA      Zero-Lag Exponential Moving Average
  11. DEMA                Double Exponential Moving Average by P.Mulloy
  12. T3_basic           T3 by T.Tillson (original version)
  13. ITrend               Instantaneous Trendline by J.Ehlers
  14. Median              Moving Median
  15. GeoMean           Geometric Mean
  16. REMA                 Regularized EMA by C.Satchwell
  17. ILRS                   Integral of Linear Regression Slope
  18. IE_2                   Combination of LSMA and ILRS
  19. TriMAgen            Triangular Moving Average generalized by J.Ehlers
  20. VWMA                Volume Weighted Moving Average
  21. JSmooth             M.Jurik's Smoothing
  22. SMA_eq              Simplified SMA
  23. ALMA                 Arnaud Legoux Moving Average
  24. TEMA                 Triple Exponential Moving Average by P.Mulloy
  25. T3                     T3 by T.Tillson (correct version)
  26. Laguerre            Laguerre filter by J.Ehlers
  27. MD                     McGinley Dynamic
  28. BF2P                  Two-pole modified Butterworth filter by J.Ehlers
  29. BF3P                  Three-pole modified Butterworth filter by J.Ehlers
  30. SuperSmu           SuperSmoother by J.Ehlers
  31. Decycler             Simple Decycler by J.Ehlers
  32. eVWMA               Modified eVWMA

What prices are used to construct moving averages:

  1.    close                       Close
  2.    open                        Open
  3.    high                         High
  4.    low                          Low
  5.    median                    Median
  6.    typical                     Typical
  7.    haClose                    Heiken Ashi Close
  8.    haOpen                    Heiken Ashi Open
  9.    haHigh                     Heiken Ashi High   
  10.    haLow                      Heiken Ashi Low
  11.    haMedian                 Heiken Ashi Median
  12.    haTypical                 Heiken Ashi Typical
  13.    haWeighted              Heiken Ashi Weighted Close

________________________________________________________________________________________________________________________________________________________________________________________________________________________________


Speed_Pips                            = 4                  If the line slope speed is less than specified, the coloring is yellow

TimeFrame                            = 0                  Selecting the timeframe

Price                                     = close             Choice of prices used
MA_Period                             = 14                 Averaging period of the moving average
MA_Shift                               = 0                   Shift the moving average by a specified number of periods 
MA_Method                           = SMA               Choice of moving average formula
ShowInColor                          = true              Show/hide color rendering, up-trend color selection, down-trend color selection
Number of bars counted        = 0                   Plotted on the chart for a specified number of candles (bars), "0" - all bars are involved in the construction       

Alerts, Emails & Notifications

AlertOn                                = false              Disable/enable sound alerts when changing the direction of the moving average
AlertShift                             = 1                    Shift of periods (candlesticks), after which the notification about the change of direction of the moving average will come
SoundsNumber                     = 5                    Number of sound alerts
SoundsPause                        = 5                    Pause in seconds between sound alerts
UpTrendSound                      = "alert.wav"     Selecting a sound file when a trend changes from downtrend to uptrend
DnTrendSound                      = "alert2.wav"   Selecting a sound file when a trend changes from uptrend to downtrend
EmailOn                               = false              Disable/enable sending messages to email
EmailsNumber                      = 1                   Number of messages to be sent to the mail

PushNotificationOn               = false              Disable/enable "push" messaging to your smartphone


Produits recommandés
Trend Scanner looks at the Market watchlist and Checks to see if there are trending cases between three (3) timeframes selected by the user. The analysis can assist in finding pairs to focus on for a particular session where a trader may need to have a bias in terms of direction to place trades for a particular system which requires multiple timeframe filtration of bar momentum. 3 Main indicators are involved: Moving Average, MACD and Heiken Ashi. User is able to select timeframes available on
This is a professional multi currency tool. Its main purpose is semi-automatic Forex trading following Elder's Triple Screen strategy. Its wide functionality and ability to quickly change some essential parameters makes it an ideal market interpretation tool, which is indispensable in the common trade analysis. Its main advantage is almost unlimited number of simultaneously analyzed instruments. If the potential technical limits of your monitor resolution allow, multiple indicators can be used.
Keltner Channel MultiBand – Period 20 | ATR 10 | Bands 1.5, 2.0, 2.5 Unlock Precise Market Timing with Triple-Band Trend Mapping The Keltner Channel MultiBand is a powerful technical tool designed to help traders identify trend opportunities , optimize entry points , and strategically place Take Profit (TP) and Stop Loss (SL) levels. Key Features: Triple Bands (1.5x, 2.0x, 2.5x ATR) : Offers a multi-layered view of price volatility, helping you gauge the strength of market momentum with gr
Indicator for binary options arrow is easy to use and does not require configuration works on all currency pairs, cryptocurrencies buy signal blue up arrow sell signal red down arrow tips do not trade during news and 15-30 minutes before their release, as the market is too volatile and there is a lot of noise it is worth entering trades one or two candles from the current period (recommended for 1 candle) timeframe up to m 15 recommended money management fixed lot or fixed percentage of the depo
The Pipsometer Pro Indicator is an essential, minimalist tool designed for the disciplined trader who requires immediate, at-a-glance financial feedback. It functions as a dedicated, real-time display that continuously calculates and shows your current floating profit or loss, measured exclusively in **pips**, for every open trade on the active chart. This focus on pips rather than monetary value allows traders to assess market performance and price movement directly, stripping away the emotion
FREE
MajorAlert
Sergei Vassunov
MajorAlert - is a professional trading indicator for MetaTrader 4 that combines two distinct market analysis approaches into one powerful tool. By integrating a counter‑trend entry logic (upper block) with a trend‑following filter (lower block), the indicator generates high‑probability signals on the chart with clearly separated arrow colors. Key Features Fully self‑contained   – no external indicators required; all calculations are built‑in. Versatile inputs   – adjust all parameters to suit a
The indicator is designed for opening trades for a long period. he is set up to get as many points from each trade as possible. he uses the scalping method... you can trade on any currency pairs indicator is already  you can trade at any time of the day but the preferred time of trading during the European American session. currency pairs eur / jpy, eur / usd currency pairs with high volatility then the results are much better.
Urgently
Tatiana Savkevych
The Urgently indicator is designed to quickly determine the situation in the market, reflect the state of the market and signal profitable levels for opening trades. Market conditions change quickly enough, requiring constant calibration of trading strategies. Recommended for use in conjunction with any of the oscillators. The Urgently forex market trend indicator shows the trend direction and entry points. It smooths out price fluctuations when generating a signal by averaging the data and the
Moving Average Alert
Christianiel Robles Faustino
4 (2)
Stop Watching the Moving Average. Get Alerted. Moving Average Alert  automatically monitors price interaction with your Moving Average and alerts you when your selected   candle and price-action conditions   occur. Don't settle for a basic MA crossover alert. KEY FEATURES   Close Above MA Detect bullish candles closing above the Moving Average.   Close Below MA Detect bearish candles closing below the Moving Average.   Close Above/Below MA Monitor both bullish and bearish MA brea
To get a signal, the indicator uses the linear break formula, the signal is not redrawn, since no indicators based on the moving average are used to get the signal, only price values ​​and chart candles Indicator settings 1 Line for signal  - number of lines for forming a signal breakthrough 2 Up arrow colore - color of the up arrow 3 Down arrow colore - color of the down arrow 4 MTF period in minutes  - selection of the period for multi-timeframe display (in minutes) 5 UpArrowCode  - code of t
Trend Line Alert MT4
Christianiel Robles Faustino
Stop Watching Trend Lines. Get Alerted. Trend Line Alert  automatically monitors your diagonal trend lines and alerts you when price closes above, closes below, or touches the line . Go beyond a basic trend-line alert with candle and price-action confirmation designed to help you focus on higher-quality setups. KEY FEATURES Close Above Trend Line Get alerted when a qualifying candle closes above your trend line. Close Below Trend Line Detect bearish breaks when price closes below th
The proposed indicator is based on the ZigZag Mini Extra indicator ( https://www.mql5.com/ru/market/product/42632 ). Unlike the prototype can be built at the price of Close or High-Low with the established timeframe. The prices of the current timeframe will be used when calculating the indicator on the highest timeframes at Close price, . Indicator parameters: ZigZag TimeFrame = PERIOD_CURRENT - operating time frame (must be equal or more than current timeframe); Depth = 12 - depth of loca
Indicador Taurus All4
Fabio Oliveira Magalhaes
Taurus All4 Taurus All4 is a high-performance indicator, it will tell you the strength of the trend, and you will be able to observe the strength of the candle. Our indicator has more than 4 trend confirmations. It is very simple and easy to use. Confirmation Modes Candle Trend Confirmations: When the candle switches to light green the trend is high. When the candle switches to light red the trend is reverting down. When the candle changes to dark red the trend is low. Trendline Trend Confirm
Zig Zag Robot: A Comprehensive Reversal Trading System The Zig Zag Robot is a powerful tool designed to accurately identify key market reversals and filter out market "noise." It goes beyond a simple Zig Zag indicator by combining multiple tools and built-in logic to provide you with ready-to-use trading signals and help you make more informed decisions. How It Works The indicator uses a multi-level approach to market analysis, which allows it to find high-probability entry points: Signal Filter
TopArrow
Artur Khanov
The arrow indicator without redrawing shows potential entry points into the market in the form of arrows of the appropriate color: the up arrows (usually green) suggest opening a purchase, the red down arrows suggest selling. The appearance of arrows may be accompanied by beeps. It is usually assumed to enter at the next bar after the pointer, but there may be non-standard recommendations. Arrow indicators visually "unload" the price chart and save time for analysis: no signal – no deal, if ther
PipsZenith Trend Range Assistant Overview The PipsZenith Trend Range Assistant is a clean, professional MT4 indicator designed to help traders quickly identify whether the market is in a trend (bullish/bearish) or range (sideways). It removes guesswork and prevents false trades in choppy conditions by combining Moving Average slope and ADX strength filters, while also offering Heiken Ashi confirmation for smoother trading decisions. This tool is lightweight, intuitive, and built with contr
Tiger Trend
Leandro Bernardez Camero
Tiger Trend – Indicateur de retournement de tendance basé sur une plage dynamique Rejoignez le canal pour rester informé : https://www.mql5.com/en/channels/forexnewadvisor Tiger Trend est un indicateur de tendance dynamique conçu pour détecter les retournements de tendance potentiels à partir de niveaux de support et de résistance adaptatifs calculés sur la base des plages de prix récentes. Il aide les traders à identifier les changements de momentum en analysant les clôtures des prix par rappo
Stop switching between charts just to understand the moving-average structure. CrossMap MTF MA Zones brings every important crossover, gap, age, and origin zone onto one chart. CrossMap MTF MA Zones is a clean, fully adjustable multi-timeframe moving-average indicator designed to show where each crossover began, how mature it is, and whether the distance between the averages is expanding or shrinking. The indicator can monitor every standard timeframe from M1 to MN1 while displaying only the ti
Gold Signal Swing Pro XAUUSD with Auto TP SL (MT4) — Système de 7 filtres + Garantie RR pour le trading swing XAUUSD Pas de repaint. Pas de redraw. Pas de retard. Tous les signaux sont verrouillés après confirmation. Bonus pour les acheteurs : Recevez AI Zone Radar (valeur $59) + manuel PDF gratuit avec l'achat. Envoyez-moi un message sur MQL5 après l'achat. AI Zone Radar : https://www.mql5.com/en/market/product/175834 Version MT5 également disponible : https://www.mql5.com/en/market/product/170
Infinity Trend Pro
Yaroslav Varankin
1 (1)
This is a trend indicator without redrawing Developed instead of the binary options strategy (by the color of the Martingale candlestick) Also works well in forex trading When to open trades (binary options) A signal will appear in the place with a candle signaling the current candle It is recommended to open a deal for one candle of the current timeframe M1 and M5 When a blue dot appears, open a deal up When a red dot appears, open a trade down. How to open trades on Forex. When a signal is rec
Market Ticker
John Louis Fernando Diamante
The only Market Ticker on the market! Add a professional novelty to your workspace, with built in mini-charts A scrolling Market Ticker that displays price changes from all symbols in the Market Watch list. Provides an easy snapshot of symbol prices, and keeps scrolling automatically while you trade and analyse the chart. The ticker color (+/- price changes) are based on either the current or completed candle, and the previous candle. Options include: - MTF, eg choose to show price changes of
Purpose The indicator is intended for manual multi-currency trading based on the Triple Screen Strategy. It works with any symbols located in the Market Watch window of the MT4: currencies, metals, indexes, etc. The number of instruments can be limited by capacity of the МТ4's parameters. But if desired, you can create several windows with various set of instruments and parameters. Operation Principle The indicator uses the modified Triple Screen Strategy for determining trend direction in the
L'Apollo Price Action System est un indicateur de trading puissant, entièrement fondé sur les principes de la « Price Action » (action des prix). Il analyse le comportement du marché et des prix afin d'identifier des opportunités de trading à forte probabilité de réussite. Dès que les conditions de marché requises par la stratégie interne de l'indicateur sont réunies, il génère un signal d'achat ou de vente. Veuillez me contacter après votre achat pour obtenir mes conseils de trading ainsi qu'u
GeoWprPro
Georgij Komarov
WPR by Profile, or WPR for Professionals Geo_WprPro is one of the well-known currency profile indicators. It simultaneously displays two WPR indicators with different parameters in the matrix form on all timeframes of multiple currency pairs forming the currency profile . As follows from the description, " WPR is a leading indicator that often goes ahead of the price chart. The oscillator frequently reaches extreme values before the price reversal as if anticipating that event: it almost always
TMA AI Bands
Monique Ellen Miranda Dos Santos
L'indicateur TMA AI Bands est basé sur la Moyenne Mobile Triangulaire (TMA) avec des bandes supérieure et inférieure dynamiques et des flèches claires d'achat/vente tracées directement sur le graphique. Il intègre une IA pour une optimisation adaptative et garantit l'absence de repainting, fournissant des signaux de renversement précis lorsque le prix touche les bandes. * Paires : fonctionne avec toutes les paires de devises * Échelles de temps recommandées : D1 / W1 / MN * Variables externe
Markets Heat
Viktor Yatsyshyn
Markets Heat indicator can help you determine correct course of action at current market situation, by calculating market's "heat level". What is market's "heat level"? Well, it's my own way of simplifying complex market conditions to ease decision-making process. How does it work? Most of time market is moving in some narrow range and can't "decide" where to go -> flat market -> cold market. Other times, price goes Up or Down -> making trend movements -> heating the market. More powerful trends
TPA True Price Action indicator reveals the true price action of the market makers through 100% non-repainting signals (except early signals mode) strictly at the close of a candle! TPA shows entries and re-entries, every time the bulls are definitely stronger than the bears and vice versa. Not to confuse with red/green candles. The shift of power gets confirmed at the earliest stage and is ONE exit strategy of several. There are available now two free parts of the TPA User Guide for our custom
Pro Period Separators MT4
Zhi Wen Software Development
Pro Period Separators For MetaTrader 4 The built-in period separators feature doesn’t allow users to specify the time period, so you can use this indicator to create advanced period separators, you can add daily, weekly, monthly, yearly separators on any time frame. Default Inputs DAILY SEPARATOR SETTINGS show daily separators  = Yes hour of the separators = 04 minute of the separators = 00 color of the separators = Silver width of the separators = 1 style of the separators = STYLE_DOT WEEKLY_SE
[75% OFF! - SALE ENDS SOON] -  RevCan Trend Entry Point is a trend based trade alert indicator for serious traders. It does all the price and chart analysis all by itself, and whenever it finds any potential high quality trading opportunity(Buy or Sell) using its revolutionized price prediction algorithms, it sends instant trade alert directly on the chart, MT4 terminal and on the mobile device.  The trade signals will be visible on the chart as Up and Down arrows, while the instant audible aler
Your Good Friends — this is not just an indicator, but your reliable trading assistant, designed for traders who value simplicity, clarity, and stability. It combines the best classic methods of technical analysis — support and resistance levels, reversal signals, visual cues — and presents them in the clearest, most user-friendly format possible. Suitable for both beginners and experienced traders — especially those who want to eliminate chaos, reduce stress, and trade based on clear signals.
Les acheteurs de ce produit ont également acheté
Currency Strength Wizard est un indicateur très puissant qui vous offre une solution tout-en-un pour un trading réussi. L'indicateur calcule la puissance de telle ou telle paire de devises en utilisant les données de toutes les devises sur plusieurs périodes. Ces données sont représentées sous la forme d'un indice de devise facile à utiliser et de lignes électriques de devise que vous pouvez utiliser pour voir la puissance de telle ou telle devise. Tout ce dont vous avez besoin est d'attacher l'
Trend SniperX MT4
Sarvarbek Abduvoxobov
5 (6)
Trend Sniper X est un indicateur de suivi de tendance multi-temporalité pour MetaTrader 5 qui aide les traders à identifier la direction de la tendance et les points de retournement potentiels avec clarté et précision. Pour MT5 : https://www.mql5.com/en/market/product/181101 Information sur le prix : Le prix actuel est une offre promotionnelle et peut évoluer au fur et à mesure de la sortie des prochaines mises à jour et nouvelles fonctionnalités. Canal Code2Profit Maîtrisez le marché grâce à l'
Scalper Vault
Oleg Rodin
4.9 (41)
Scalper Vault est un système de trading puissant et complet, conçu pour les traders en quête de régularité dans le cadre du trading intrajournalier. Cet indicateur de haute précision constitue un système de trading autonome et exhaustif, offrant des analyses de qualité institutionnelle, aussi bien pour le Forex que pour les options binaires. VEUILLEZ ME CONTACTER APRÈS VOTRE ACHAT POUR OBTENIR MES CONSEILS DE TRADING AINSI QU'UN EXCELLENT BONUS ! En éliminant les incertitudes et les analyses ma
Smart Trend Trading System est un indicateur pour MetaTrader 4 qui réunit les informations de tendance, les signaux d’entrée et de sortie et les niveaux de prix sur un même graphique. Il combine plus de 10 outils de trading en un seul système, incluant la détection de tendance, les zones de retournement, Smart Cloud, la logique de trailing stop, le support et la résistance, la coloration des bougies, les alertes et l’analyse multi-timeframe. Le système est conçu pour vous aider à trader différen
SIO Oscillator : oscillateur auto-optimisé de déséquilibre de semi-variance Achetez l’indicateur et recevez GRATUITEMENT l’Expert Advisor (EA) basé sur celui-ci. La plupart des oscillateurs traitent tous les mouvements de prix de la même manière. SIO sépare la pression haussière de la pression baissière et mesure le déséquilibre entre les deux, montrant quel camp contrôle réellement le marché : les acheteurs ou les vendeurs. Lorsque le déséquilibre atteint un extrême, SIO génère un signal clair
Advanced Supply Demand
Bernhard Schweigert
4.91 (302)
Offre spéciale : 30 % de réduction La solution idéale pour les traders débutants comme experts ! Cet indicateur est un outil de trading unique, performant et abordable grâce à l’intégration de nombreuses fonctionnalités exclusives et d’une nouvelle formule. Cette mise à jour vous permet d’afficher des zones sur deux unités de temps. Vous pourrez ainsi visualiser non seulement une unité de temps supérieure, mais aussi l’unité de temps du graphique, ainsi que l’unité de temps supérieure : des z
M1 Sniper
Oleg Rodin
4.97 (30)
M1 SNIPER est un système d'indicateurs de trading facile à utiliser. Il s'agit d'un indicateur à flèche conçu pour l'unité de temps M1. Cet indicateur peut être utilisé seul pour le scalping sur l'unité de temps M1 ou intégré à votre système de trading existant. Bien que conçu spécifiquement pour le trading sur l'unité de temps M1, ce système peut également être utilisé avec d'autres unités de temps. Initialement, j'avais conçu cette méthode pour le trading du XAUUSD et du BTCUSD. Cependant, je
Non repaint MT4
Yan Zhen Du
5 (2)
This is a professional chart indicator designed for traders focused on stability and clear price action. It helps filter market noise and provides clear visual entry and exit zones for your trading decisions. Core Features: Strictly Non-Repainting: The system is built with strict non-repaint logic. What you see on the chart is the true historical performance. Confirmed Signals: Signals are triggered and confirmed only after the candle closes . Once a trading arrow appears on a closed candle, it
Gann Made Easy
Oleg Rodin
4.84 (174)
Gann Made Easy est un système de trading Forex professionnel et facile à utiliser qui est basé sur les meilleurs principes de trading en utilisant la théorie de mr. WD Gann. L'indicateur fournit des signaux d'ACHAT et de VENTE précis, y compris les niveaux Stop Loss et Take Profit. Vous pouvez échanger même en déplacement en utilisant les notifications PUSH. VEUILLEZ ME CONTACTER APRÈS L'ACHAT POUR RECEVOIR GRATUITEMENT DES INSTRUCTIONS DE TRADING ET D'EXCELLENTS INDICATEURS SUPPLÉMENTAIRES! Vou
Actuellement 30% de réduction ! La meilleure solution pour tout débutant ou trader expert ! Ce logiciel de tableau de bord fonctionne sur 28 paires de devises. Il est basé sur 2 de nos principaux indicateurs (Advanced Currency Strength 28 et Advanced Currency Impulse). Il donne un excellent aperçu de l'ensemble du marché Forex. Il montre les valeurs de l'Advanced Currency Strength, la vitesse de mouvement des devises et les signaux pour 28 paires de devises dans tous les (9) délais. Imaginez
Nous vous présentons ON Trade Waves Patterns Harmonic Elliot Wolfe, un indicateur avancé conçu pour détecter divers types de schémas sur le marché à l'aide de méthodes manuelles et automatiques. Voici comment il fonctionne : Schémas Harmoniques : Cet indicateur peut identifier les schémas harmoniques qui apparaissent sur votre graphique. Ces schémas sont essentiels pour les traders qui pratiquent la théorie du trading harmonique, telle qu'elle est décrite dans le livre de Scott Carney "Harmonic
Zoryk Gold mt4
Reda El Koutbane
5 (3)
ZORYK — Système avancé de signaux et de planification pour XAUUSD sur MetaTrader 4 Vous connaissez probablement cette situation. Vous analysez l’or, attendez l’entrée, puis ouvrez enfin la position. Le prix part immédiatement contre vous. Vous fermez trop tôt, déplacez le Stop Loss ou hésitez quelques secondes. Peu après, le marché atteint exactement la direction et l’objectif que vous aviez prévus, mais sans vous. Le problème n’était pas toujours la direction. Le véritable problème était l
RFI levels PRO
Roman Podpora
5 (2)
L'indicateur montre avec précision les points de retournement et les zones de retour des prix où le       Acteurs majeurs   . Vous repérez les nouvelles tendances et prenez des décisions avec une précision maximale, en gardant le contrôle de chaque transaction. VERSION MT5     -     Révèle son potentiel maximal lorsqu'il est combiné à l'indicateur   TREND LINES PRO Ce que l'indicateur montre : Structures et niveaux d'inversion avec activation au début d'une nouvelle tendance. Affichage des nive
Atomic Analyst
Issam Kassas
5 (14)
Atomic Analyst — MetaTrader 4 Pour toute question sur le produit, sa configuration ou le support technique, envoyez-moi un message directement ici sur MQL5. L’indicateur transforme des calculs complexes du marché en signaux visuels simples, bougies colorées, lectures de tendance, niveaux de stop-loss et plusieurs zones de take-profit que les traders peuvent comprendre rapidement et utiliser dans des conditions réelles de marché. Principales utilisations de trading : Scalping et trading intraday
ShapeRadar - indicateur de figures chartistes classiques ShapeRadar repère automatiquement sur le graphique les figures classiques de l’analyse technique : doubles et triples sommets et creux, tête et épaules et sa version inversée, biseaux ascendants et descendants, rectangles, triangles, drapeaux et fanions. Lorsque le prix clôture au-delà de la limite d’une figure, l’indicateur trace la figure, le point d’entrée, le niveau de stop loss et l’objectif, et un panneau d’information résume toutes
Liquidity Scalper System : un système de trading basé sur la liquidité au format indicateur. La plupart des indicateurs n'affichent qu'une flèche, puis le trader décide seul où placer le stop, où se trouve l'objectif et s'il peut faire confiance au signal. Liquidity Scalper System couvre tout le cycle du trade : il trouve les pools de liquidité, donne un signal lors de leur cassure, calcule immédiatement Entry, Stop Loss et trois objectifs, et affiche sur le panneau les statistiques et les résu
Le système PRO Renko est un système de trading très précis spécialement conçu pour le trading de graphiques RENKO. Il s'agit d'un système universel qui peut être appliqué à divers instruments de négociation. Le système neutralise efficacement ce qu'on appelle le bruit du marché en vous donnant accès à des signaux d'inversion précis. L'indicateur est très facile à utiliser et n'a qu'un seul paramètre responsable de la génération du signal. Vous pouvez facilement adapter l'outil à n'importe que
SR Liquidity
Oleg Rodin
5 (2)
SR Liquidity est un indicateur de trading conçu pour révéler les zones cachées où se concentre la liquidité du marché et où le prix réagit avec le plus d'intensité. Ces zones de liquidité spécifiques agissent comme de puissants niveaux de support et de résistance, vous offrant une cartographie claire des points où le marché est le plus susceptible de se retourner. Plutôt que de tracer des lignes de support et de résistance classiques, l'indicateur SR Liquidity analyse le comportement réel des pr
Auto Optimized SpeedAngle est un système de vectorisation du momentum de niveau institutionnel qui élimine l'ajustement de courbe ( curve-fitting ) grâce à une optimisation continue par avancement ( Walk-Forward Optimization , WFO). Plutôt que de s'appuyer sur des entrées statiques qui se dégradent lorsque les régimes de marché changent, l'indicateur recalibre dynamiquement ses paramètres en utilisant une validation hors échantillon ( Out-of-Sample , OOS), garantissant ainsi que les signaux affi
Italo Volume Indicator
Italo Santana Gomes
4.92 (79)
BUY INDICATOR AND GET EA FOR FREE AS A BONUS + SOME OTHER GIFTS! ITALO VOLUME INDICATOR  is the best volume indicator ever created, and why is that? The Indicator works on all time-frames and assets, indicator built after 7 years of experience on forex and many other markets. You know many volume indicators around the internet are not complete, does not help, and it's difficult to trade, but the Italo Volume Indicator is different , the Italo Volume Indicator shows the wave volume, when market
Il estime le mouvement de prix le plus probable à court terme à partir de calculs mathématiques avancés. Caractéristiques Estimation du mouvement immédiat du prix sur l'unité de temps du graphique et sur toutes les unités supérieures ; Calcul de la tendance réelle du marché ; Calcul des niveaux de support et de résistance les plus importants ; Alertes sur les zones de congestion, les croisements de niveaux et les changements de tendance ; Léger pour les ressources du système : les lignes et le
Route Lines Prices
Vitalyi Belyh
3 (1)
Route Lines Prices - est un indicateur conçu pour identifier les directions des prix. Son interface simple intègre plusieurs algorithmes de calcul du comportement des prix et de leur direction future. Ces algorithmes incluent le calcul de la volatilité et le lissage des prix en fonction des unités de temps utilisées. L'indicateur possède un unique paramètre permettant de modifier la valeur « Calculating price values ». La valeur par défaut de 1 assure un calcul automatique équilibré, utilisabl
CRT Candle Range Theory HTF MT4 - Ultimate CRT Indicator : Concepts ICT avancés et système de trading Malaysian SnR Maîtrisez les traces des Market Makers avec l'indicateur Candle Range Theory le plus avancé. Libérez la véritable puissance des Smart Money Concepts (SMC) et tradez avec la même précision que les institutions grâce à l'Ultimate CRT Indicator. Conçu exclusivement pour les traders sérieux, cet indicateur automatiza la théorie CRT, un pilier central des concepts ICT (Inner Circle Trad
All in One package includes the  Oscillator Predictor ,  MACD Predictor ,  Thrust Scanner  and  Advanced Fibonacci  indicators which are mandatory for applying  Dinapoli  trade plans.  Please visit below links for detailed explanations of indicators. Advanced Fibonacci Indicator =>  https://www.mql5.com/en/market/product/52834 Thrust Scanner Indicator => https://www.mql5.com/en/market/product/52830 Overbought /Oversold Predictor indicator => https://www.mql5.com/en/market/product/52621 Macd P
Imbalance Pro
Ivan Stefanov
5 (4)
L'indicateur mesure le déséquilibre entre les haussiers et les baissiers sur une période donnée et affiche une ligne droite entre les deux points. Si les haussiers ont plus de volume que les baissiers, la ligne devient verte.  Si les baissiers ont plus de volume, elle est rouge. La ligne indique également le pourcentage de différence de volume. L'indicateur affiche les mêmes données dans une fenêtre séparée. Vous pouvez également voir le volume divisé. L'indicateur a deux modes. À cet effe
AW Prime Oscillator
AW Trading Software Limited
5 (1)
Une combinaison de deux oscillateurs. Le premier affiche les points d'entrée, le second montre la tendance actuelle. L'indicateur peut afficher les signaux d'oscillateur par des flèches dans deux modes, tous les signaux d'oscillateur rapides ou les signaux uniquement dans la direction de la tendance actuelle. Il dispose d'un panneau multi-périodes et de trois types de notifications de signal. Avantages: Convient au day trading et au scalping Filtrage des tendances Configuration simple et sensibl
True Direction Oscillator
Muhammad Elbermawi
4.85 (364)
Ou (TDO) qui est un indice qui mesure le taux de variation des prix en utilisant le principe du « Pure Momentum ». Lorsque le prix d'un titre augmente de 10 à 15, le taux de variation du prix est de 150 %, mais lorsqu'il redescend de 15 à 10, le taux de variation du prix n'est que de 33,3 %. C'est pourquoi les indicateurs d'analyse technique tels que « Taux de variation des prix » (ROC) ou « Momentum » donnent des lectures plus élevées pour les mouvements de prix ascendants que ceux donnés aux m
Indicateur de trading manuel et d'analyse technique pour le Forex. Il se compose d'un indicateur de tendance avec le niveau d'ouverture du jour de bourse et d'un indicateur de flèche pour déterminer les points d'entrée. L'indicateur ne se recolore pas ; il fonctionne lorsque la bougie se ferme. Contient plusieurs types d'alertes pour les flèches de signalisation. Peut être configuré pour fonctionner sur n’importe quel graphique, instrument de trading ou période. La stratégie de travail est bas
Dark Support Resistance  is an Indicator for intraday trading. This Indicator is programmed to identify  Support and Resistance Lines , providing a high level of accuracy and reliability. Key benefits Easily visible lines Only the most important levels will be displayed Automated adjustment for each timeframe and instrument Easy to use even for beginners Never repaints, never backpaints, Not Lag 100% compatible with Expert Advisor development All types of alerts available: Pop-up, Email, Push

Volume Profile : multimode, multiprofil, dessiné sur le graphique de prix L'indicateur dessine un profil de volume directement sur le graphique de prix, avec la ligne Point of Control (POC), la Value Area (VAH et VAL) et des pics et creux optionnels. Au lieu de lire le volume dans un panneau inférieur séparé, le volume est affiché aux niveaux de prix où il a été échangé, de sorte que le prix et le volume peuvent être lus au même endroit. Ce que l'indicateur affiche Ligne POC (Point of Control) :
Plus de l'auteur
Новая версия индикатора консолидаций Consolidation box Generator. Предыдущая версия тут . Примеры настроек на индикатор тут . На данный момент этот инструмент анализа рынка уже нельзя назвать просто индикатором. Потому как это торговая стратегия. Наше ноу-хау заключается в том, что данный индикатор не требует огромного количества тестов в тестере стратегий. В индикаторе реализован блок статистики - при нанесении на график вам сразу будет видна результативность работы стратегии. Вы можете настро
Filtrer:
Aucun avis
Répondre à l'avis