Voir comment télécharger gratuitement des robots de trading
Retrouvez-nous sur Twitter !
Rejoignez notre page de fans
Rejoignez notre page de fans
Vous avez aimé le script ? Essayez-le dans le terminal MetaTrader 5

Altarius_RSI&Stoh - expert pour MetaTrader 4
- Vues:
- 15612
- Note:
- Publié:
- Mise à jour:
-
 Vous manquez des opportunités de trading :
- Applications de trading gratuites
- Plus de 8 000 signaux à copier
- Actualités économiques pour explorer les marchés financiers
Inscription Se connecterVous acceptez la politique du site Web et les conditions d'utilisation
Si vous n'avez pas de compte, veuillez vous inscrire -
 Besoin d'un robot ou d'un indicateur basé sur ce code ? Commandez-le sur Freelance
Aller sur Freelance
Besoin d'un robot ou d'un indicateur basé sur ce code ? Commandez-le sur Freelance
Aller sur Freelance
The EA is composed on the combination of the RSI and Stochastic, one of its best working is shown on the chart. However, it doesn't always work this way, and for some reason it stops later on.
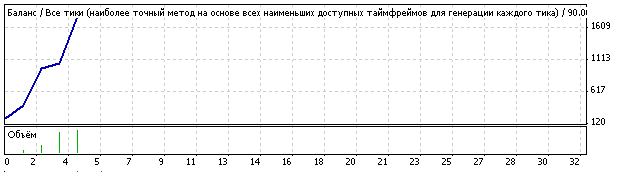
Strategy Tester Report
New_v6
Alpari-Demo (Build 217)
| Symbol | EURUSD (Euro vs US Dollar) | ||||
| Period | 30 Minutes (M30) 2008.07.01 00:00 - 2008.08.07 23:30 (2008.07.01 - 2008.08.08) | ||||
| Model | Every tick (the most precise method based on all available least timeframes) | ||||
| Parameters | Lots=1; MaximumRisk=0.8; DecreaseFactor=3; PeriodRSI=6; | ||||
| Bars in test |
2335 | Ticks modelled |
250834 | Modelling quality |
90.00% |
| Missmatched charts errors | 92 | ||||
| Initial deposit |
200.00 | ||||
| Total net profit |
1591.38 | Gross profit |
1591.38 | Gross lost |
0.00 |
| Profit factor |
Expected payoff |
397.84 | |||
| Absolute drawdown |
43.20 | Maximal drawdown |
535.50 (35.19%) | Relative drawdown |
43.52% (134.40) |
| Total trades |
4 | Short positions (% won) | 2 (100.00%) | Long positions (% won) | 2 (100.00%) |
| Profit trades (% of total) | 4 (100.00%) | Loss trades (% of total) | 0 (0.00%) | ||
| Largest | profit trade | 728.45 | loss trade | 0.00 | |
| Average | profit trade | 397.84 | loss trade | 0.00 | |
| Maximum | consecutive wins (profit in money) | 4 (1591.38) | consecutive losses (loss in money) | 0 (0.00) | |
| Maximum | consecutive profit (count of wins) | 1591.38 (4) | consecutive loss (count of losses) | 0.00 (0) | |
| Average | consecutive wins | 4 | consecutive losses | 0 | |
| № | Time | Type | Order | Volume | Price | S / L | T / P | Profit | Balance |
| 1 | 2008.07.01 01:00 | buy | 1 | 0.16 | 1.5750 | 0.0000 | 0.0000 | ||
| 2 | 2008.07.02 22:00 | close | 1 | 0.16 | 1.5878 | 0.0000 | 0.0000 | 205.26 | 405.26 |
| 3 | 2008.07.03 01:00 | sell | 2 | 0.32 | 1.5876 | 0.0000 | 0.0000 | ||
| 4 | 2008.07.03 22:30 | close | 2 | 0.32 | 1.5698 | 0.0000 | 0.0000 | 569.60 | 974.86 |
| 5 | 2008.07.03 23:00 | buy | 3 | 0.78 | 1.5706 | 0.0000 | 0.0000 | ||
| 6 | 2008.07.04 10:00 | close | 3 | 0.78 | 1.5717 | 0.0000 | 0.0000 | 88.06 | 1062.93 |
| 7 | 2008.07.04 10:30 | sell | 4 | 0.85 | 1.5711 | 0.0000 | 0.0000 | ||
| 8 | 2008.07.07 10:00 | close | 4 | 0.85 | 1.5624 | 0.0000 | 0.0000 | 728.45 | 1791.38 |
Traduit du russe par MetaQuotes Ltd.
Code original : https://www.mql5.com/ru/code/8311
 DSS Bressert - double smoothed stochastic (Double Smoothed Stochastic Indicator by Walter Bressert)
Indicator of overbuying/overselling
MA_Gideon2
Indicator MA_Gideon2.
 SymbolList
The script swaps out all the symbols available in the Market Watch window into a csv file.
SymbolList fromSet
The script extracts the list of symbols from the *.set file and saves it as the csv file.