Rejoignez notre page de fans
- Vues:
- 4776
- Note:
- Publié:
-
Besoin d'un robot ou d'un indicateur basé sur ce code ? Commandez-le sur Freelance Aller sur Freelance
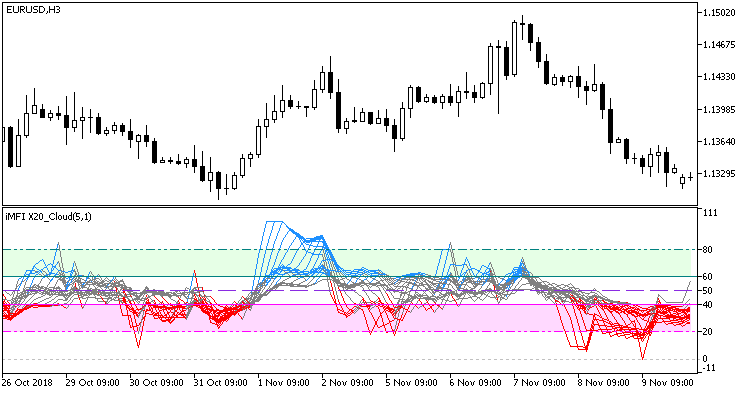
ColorMFI_X20 indicator featuring background filling in overbought/oversold areas. Filling size and position are adjustable by inputs
input uint                 HighLevelM=80;          // maximum overbought level
input uint                 HighLevel=60;           // overbought level
input uint                 MidLevel=50;            // middle level
input uint                 LowLevel=40;            // oversold level
input uint                 LowLevelM=20;           // minimum overbought level
When launching the indicator, you can change the style and color of only the first indicator line coming second in the indicator inputs color tab, while the remaining lines will have a similar look.

Fig.1. The ColorMFI_X20_Cloud indicator
Traduit du russe par MetaQuotes Ltd.
Code original : https://www.mql5.com/ru/code/23284
 ColorMFI_X20
Twenty MFI indicators displayed in one window. Each line can be colored depending on its position relative to overbought and oversold areas
 Exp_SpearmanRankCorrelation_Histogram
The trading system based on SpearmanRankCorrelation_Histogram indicator signals
 MFI_normalized
The MFI normalized indicator
 CandlesAutoFibo
The indicator builds Fibonacci levels at candlesticks High and Low, based on the timeframe specified in the indicator parameters