Rejoignez notre page de fans

MFI_normalized - indicateur pour MetaTrader 5
- Vues:
- 7943
- Note:
- Publié:
-
 Vous manquez des opportunités de trading :
- Applications de trading gratuites
- Plus de 8 000 signaux à copier
- Actualités économiques pour explorer les marchés financiers
Inscription Se connecterVous acceptez la politique du site Web et les conditions d'utilisation
Si vous n'avez pas de compte, veuillez vous inscrire -
 Besoin d'un robot ou d'un indicateur basé sur ce code ? Commandez-le sur Freelance
Aller sur Freelance
Besoin d'un robot ou d'un indicateur basé sur ce code ? Commandez-le sur Freelance
Aller sur Freelance
Bollinger Bands are used for calculating overbought/oversold zones.
There are four input parameters:
- MFI period - MFI calculation period
- MFI applied volume - volume used for MFI calculation
- BB period - Bollinger Bands calculation period
- BB deviation - Bollinger Bands deviation
Calculation:
NormMFI = (MFI-BL) / (TL-BL)
where:
TL = BBands(MFI, BB period, BB deviation, UPPER_BAND)
BL = BBands(MFI, BB period, BB deviation, LOWER_BAND)
MFI - Money Flow Index(MFI period, MFI applied volume)
BBands - UPPER_BAND and LOWER_BAND of Bollinger Bands
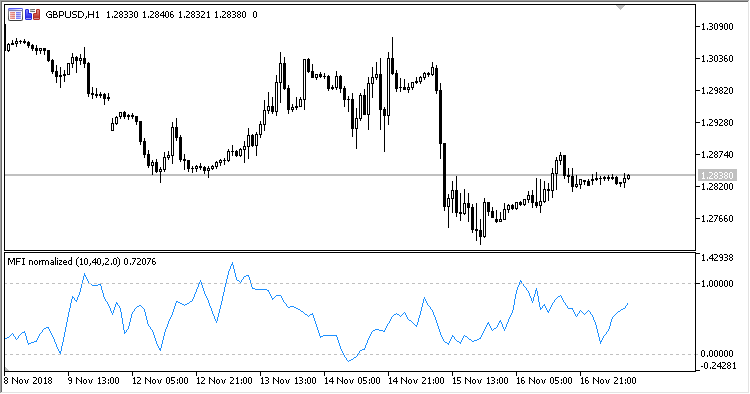
Fig.1. MFI normalized
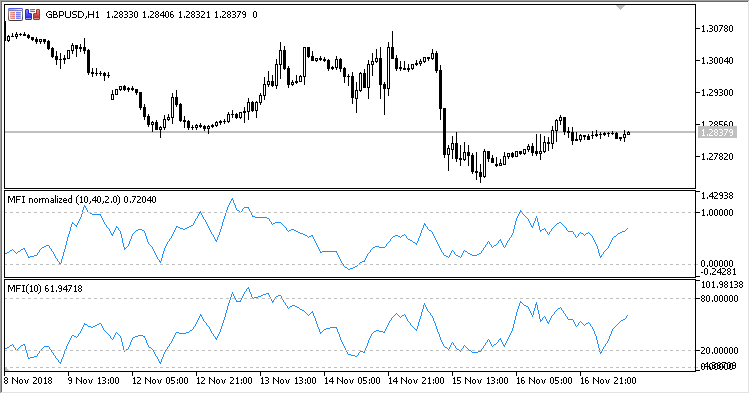
Fig.2. MFI normalized + MFI
Traduit du russe par MetaQuotes Ltd.
Code original : https://www.mql5.com/ru/code/23285
ColorMFI_X20_Cloud
The ColorMFI_X20 indicator featuring background filling in overbought/oversold areas
ColorMFI_X20
Twenty MFI indicators displayed in one window. Each line can be colored depending on its position relative to overbought and oversold areas
CandlesAutoFibo
The indicator builds Fibonacci levels at candlesticks High and Low, based on the timeframe specified in the indicator parameters
XFisher_org_v1_Vol_Supr_Zer_HTF
The XFisher_org_v1_Vol_Supr_Zer indicator with the possibility to change the indicator timeframe using input parameters