Voir comment télécharger gratuitement des robots de trading
Retrouvez-nous sur Twitter !
Rejoignez notre page de fans
Rejoignez notre page de fans
Vous avez aimé le script ? Essayez-le dans le terminal MetaTrader 5

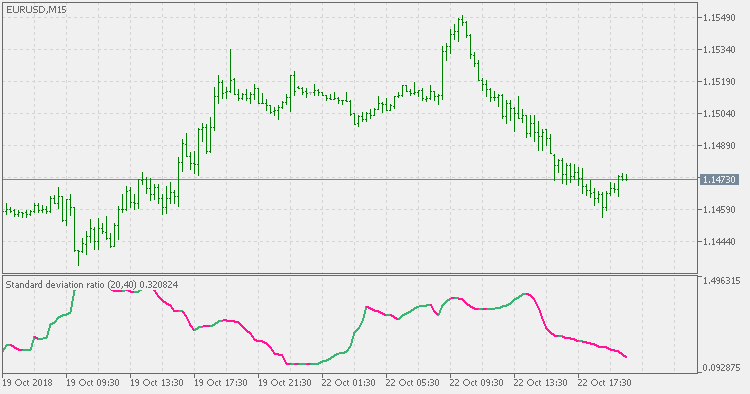
Standard deviation ratio - indicateur pour MetaTrader 5

- Vues:
- 6658
- Note:
- Publié:
- Mise à jour:
-
 Vous manquez des opportunités de trading :
- Applications de trading gratuites
- Plus de 8 000 signaux à copier
- Actualités économiques pour explorer les marchés financiers
Inscription Se connecterVous acceptez la politique du site Web et les conditions d'utilisation
Si vous n'avez pas de compte, veuillez vous inscrire -
 Besoin d'un robot ou d'un indicateur basé sur ce code ? Commandez-le sur Freelance
Aller sur Freelance
Besoin d'un robot ou d'un indicateur basé sur ce code ? Commandez-le sur Freelance
Aller sur Freelance
Theory:
The Standard Deviation Ratio (SDR) was first presented as a technical indicator in the March 1992 edition of Technical Analysis of Stocks & Commodities magazine ‘Adapting Moving Averages To Market Volatility‘. The author Tushar S. Chande, Ph.D. used it as the Volatility Index in the original version of his Volatility Index Dynamic Average (VIDYA) or Variable Moving Average (VMA).Calculating it is as simple as taking the ratio of a Standard Deviation (SD) over one period to that of a longer period where both have the same starting point. One quirk of the SDR is that because the short term SD can become greater than the longer term SD, the ratio has no upper limit but does tend to remain below 1 most of the time (see the example chart below). The higher the ratio, the more spread the recent data is from the mean in relation to the past which should indicate a stronger trend.
Usage:
The standard deviation ratio (SDR) on its own can be used in a similar mode as the regular standard deviation - as a measure of current market volatility (ie: it is not a directional indicator and it can not be used for trend direction determination - for that you need some other indicator combined with this one)
Step VHF adaptive VMA
Step VHF adaptive VMA
Averages composite trend
Trend composed by a series of averages
Standard deviation ratio adaptive EMA
Standard deviation ratio adaptive EMA
 Tunnel Method
Trading based on three iMAs (Moving Average, MA)