Rejoignez notre page de fans

RSX QQE - indicateur pour MetaTrader 5

- Vues:
- 7360
- Note:
- Publié:
-
 Vous manquez des opportunités de trading :
- Applications de trading gratuites
- Plus de 8 000 signaux à copier
- Actualités économiques pour explorer les marchés financiers
Inscription Se connecterVous acceptez la politique du site Web et les conditions d'utilisation
Si vous n'avez pas de compte, veuillez vous inscrire -
 Besoin d'un robot ou d'un indicateur basé sur ce code ? Commandez-le sur Freelance
Aller sur Freelance
Besoin d'un robot ou d'un indicateur basé sur ce code ? Commandez-le sur Freelance
Aller sur Freelance
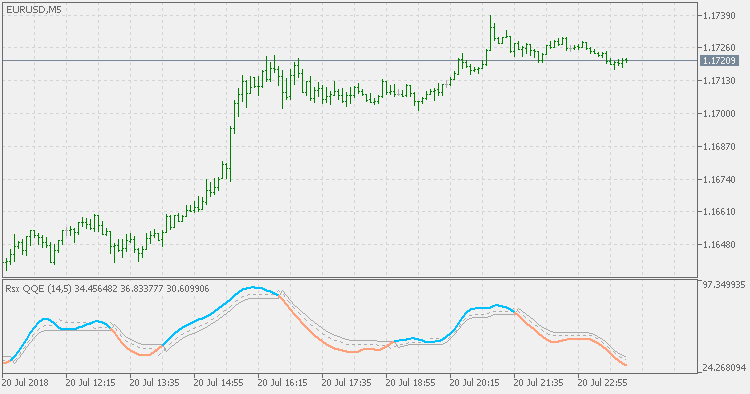
The QQE (Quantitative Qualitative Estimator) indicator consists of a smoothed Relative Strength Index (RSI) indicator and two volatility-based trailing levels (fast and slow).
The Fast Trailing Level (TL) and Slow TL are constructed by calculating the average range of the smoothed RSI over n-periods and then further smoothing the average range using an additional n-periods Wilders smoothing function. This smoothed average range of RSI is then multiplied by the Fast and Slow average range Multipliers to calculate the final Fast and Slow Trailing Levels.
This version of QQE is also using RSX (a smoother RSI without a lag) in order to further purify the signals.
QQE Histo
Compared to the original QQE indicator, this version is adding fixed levels (to help further estimate the trend) and color changing histogram (based on those levels).
QQE New
Compared to the original QQE indicator, this version instead of using trailing levels uses fixed levels to estimate overbought and oversold conditions.
RSX QQE Histo
Compared to the original QQE indicator this version is adding fixed levels (to help further estimate the trend) and color changing histogram (based on those levels), and also using RSX (a smoother RSI without a lag) in order to further purify the signals.
RSX QQE New
Compared to the original QQE indicator, this version instead of using trailing levels uses fixed levels to estimate overbought and oversold conditions. This version is also using RSX (a smoother RSI without a lag) in order to further purify the signals.