Rejoignez notre page de fans

DSL - WPR - indicateur pour MetaTrader 5

- Vues:
- 6842
- Note:
- Publié:
-
 Vous manquez des opportunités de trading :
- Applications de trading gratuites
- Plus de 8 000 signaux à copier
- Actualités économiques pour explorer les marchés financiers
Inscription Se connecterVous acceptez la politique du site Web et les conditions d'utilisation
Si vous n'avez pas de compte, veuillez vous inscrire -
 Besoin d'un robot ou d'un indicateur basé sur ce code ? Commandez-le sur Freelance
Aller sur Freelance
Besoin d'un robot ou d'un indicateur basé sur ce code ? Commandez-le sur Freelance
Aller sur Freelance
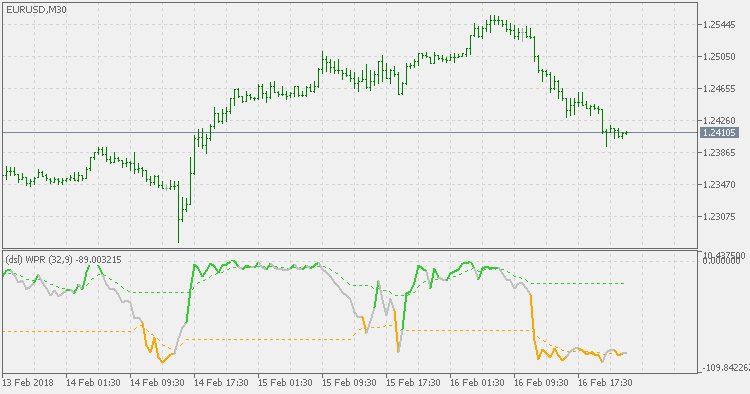
Williams' Percent Range Technical Indicator (%R) is a dynamic technical indicator, which determines whether the market is overbought/oversold. Williams' %R is very similar to the Stochastic Oscillator. The only difference is that %R has an upside down scale and the Stochastic Oscillator has internal smoothing.
- Indicator values ranging between -80% and -100% indicate that the market is oversold.
- Indicator values ranging between -0% and -20% indicate that the market is overbought.
To show the indicator in this upside down fashion, one places a minus symbol before the Williams' Percent Range values (for example -30%). One should ignore the minus symbol when conducting the analysis.
The DSL version of Williams' Percent Range does not use fixed levels for oversold and overbought levels, but is having a sort of dynamic (discontinued signal lines) calculated to identify those levels. That makes it a bit more responsive to market changes and volatile markets.
Nonlinear Kalman filter
One more from the creations of John Ehlers - nonlinear Kalman filter.
Kalman bands
This is a conversion of Kalman bands originally developed by Igor Durkin. Values are the same as MetaTrader 4 version except that we are using possibilities that MetaTrader 4 does not have to make the indicator easier to use.
DSL - stochastic
The DSL (Discontinued Signal Line) version of Stochastic does not use a moving average in a classical way for signals, but is instead calculating the signal lines depending on the value(s) of the stochastic. Thus, we are having two things : a signal line and a sort of levels that can be used for overbought and oversold estimation.
DSL - extended stochastic
The usual average that is used for stochastic calculation is simple Moving Average (SMA). This (extended) version allows you to use any of the 4 basic types of averages (default is SMA, but you can use EMA, SMMA or LWMA too) - some are "faster" then the default version (like EMA and LWMA versions) and SMMA is a bit "slower", but this way you can fine tune the "speed" to signals ratio.