Rejoignez notre page de fans
- Publié par:
- [Supprimé]
- Vues:
- 10910
- Note:
- Publié:
-
 Vous manquez des opportunités de trading :
- Applications de trading gratuites
- Plus de 8 000 signaux à copier
- Actualités économiques pour explorer les marchés financiers
Inscription Se connecterVous acceptez la politique du site Web et les conditions d'utilisation
Si vous n'avez pas de compte, veuillez vous inscrire -
 Besoin d'un robot ou d'un indicateur basé sur ce code ? Commandez-le sur Freelance
Aller sur Freelance
Besoin d'un robot ou d'un indicateur basé sur ce code ? Commandez-le sur Freelance
Aller sur Freelance
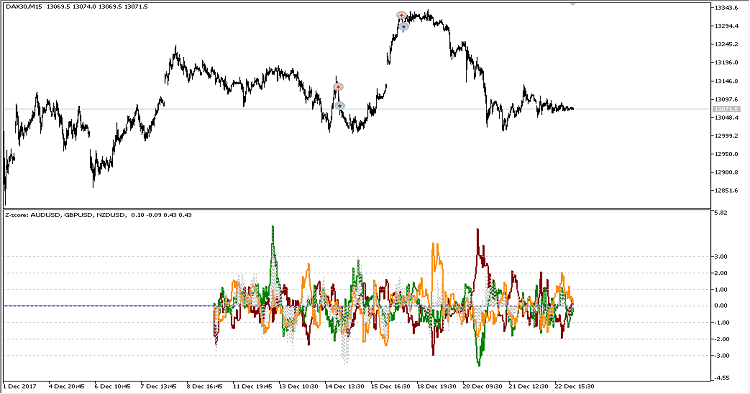
The indicator finds linear regression coefficients between each of the selected symbols and all other symbols, and displays them in the form of standard deviations. The sum of all the curves is displayed as a gray dashed histogram, which shows the deviation of the model portfolio from its real value. It can be used for experimenting with manual or automated pair trading.
Input Parameters
- learning_depth - the calculation period in bars;
- SymbolsList - required symbols separated by commas.
Traduit du russe par MetaQuotes Ltd.
Code original : https://www.mql5.com/ru/code/19630
 RMI_Histogram
Relative Momentum Index implemented as a color histogram with an indication of overbought and oversold zones.
 Exp_XFatlXSatlCloud_Duplex
Two identical trading systems based on the change in the color of XFatlXSatlCloud for long and short trades, which can be configured in different ways in one Expert Advisor.
ColorSRoC
The smoothed S-RoC indicator of the relative price increment by Fred Shutsman.
JS_SISTEM_2
The Expert Advisor uses three iMAs (Moving Average, MA), one iOsMA (Moving Average of Oscillator and one iRVI (Relative Vigor Index, RVI). Trailing stop is based on the High/Low of earlier bars.