Chanlun
- Indicadores
- Versión: 1.0
- Activaciones: 5
La teoría ChanLun o Chan es una de las teorías comerciales más populares en China. Pero parece que tiene poca influencia en los países occidentales. En realidad, la Teoría Chan se basa en un sofisticado modelo matemático. La idea básica ChanLun es simplificar el gráfico de barras por su modelo. Con la ayuda de ChanLun, un comerciante puede analizar y predecir la tendencia de los futuros bienes, acciones.
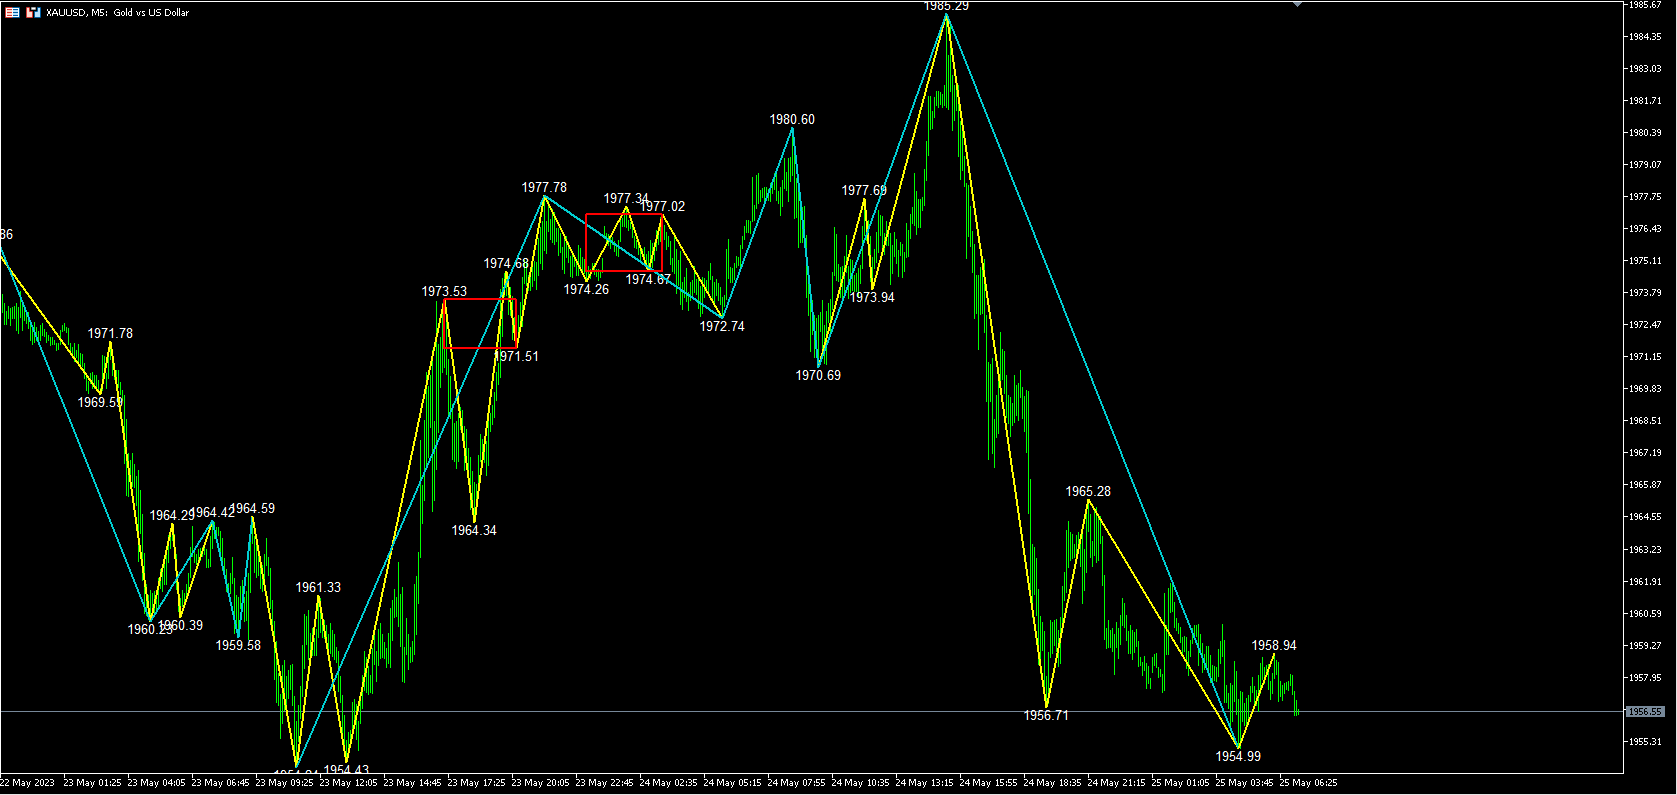
En ChanLun, hay varios elementos básicos llamados fractales, trazos, segmentos de línea y pivotes . Un operador debe pintar trazos en el gráfico en constante cambio para analizar el mercado o sus acciones objetivo. Sin embargo, pintar trazos en el gráfico es un trabajo bastante difícil y lento para la mayoría de los operadores. El objetivo de este indicador es automatizar el proceso de pintar trazos,segmentosy pivotes en el gráfico. Con este indicador, los operadores pueden analizar el mercado directamente.
Los segmentos se añaden en este indicador, que puede ayudar completamente a los usuarios dibujar todos los componentes básicos en la teoría Chan.
El color, la transparencia y el grosor de los trazos y segmentos pueden ser configurados por los usuarios.