Volume com
- Indicadores
- Versión: 1.2
- Actualizado: 8 abril 2023
- Activaciones: 5
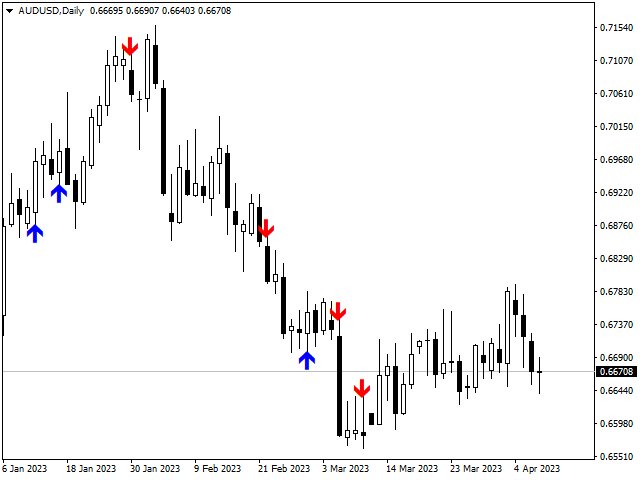
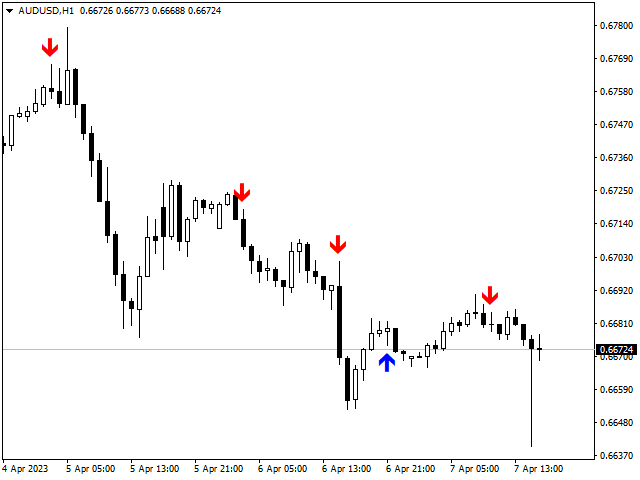
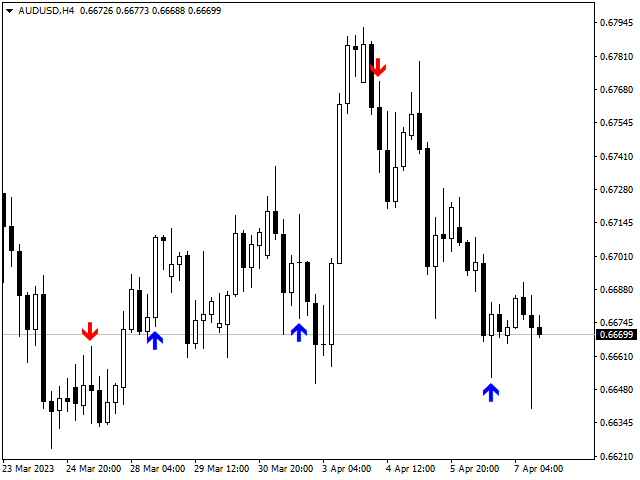
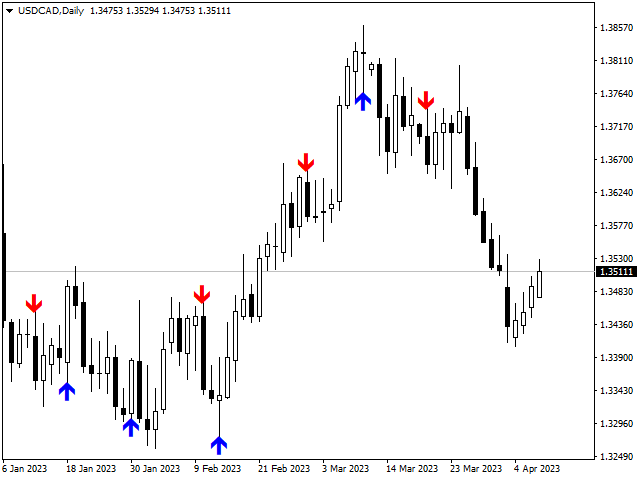
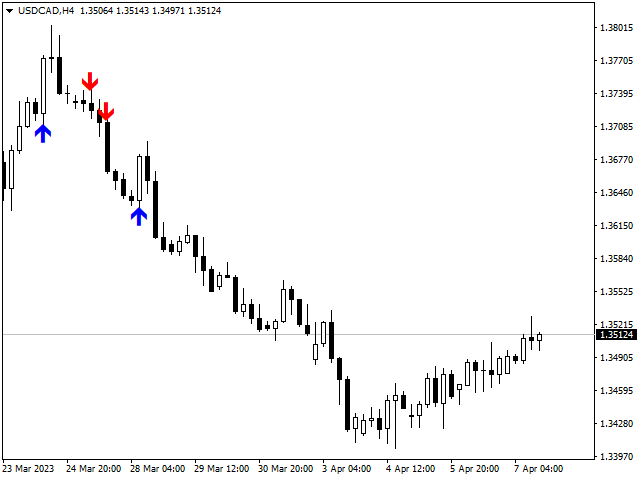
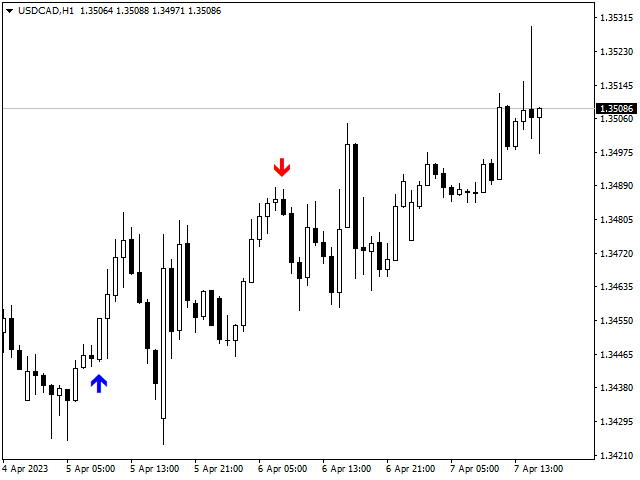
El indicador Volume com es un indicador en el que el movimiento del precio
modo de control se organiza utilizando volúmenes de ticks.
El indicador Volume com da señales que se pueden filtrar y obtener un buen resultado
La principal ventaja de las señales de este indicador es que aparecen tanto
al final de la tendencia como a lo largo de su curso.
El indicador funciona en todos los marcos temporales.
El primer indicador de la serie
.