Volume Str
- Indicadores
- Versión: 1.2
- Actualizado: 8 abril 2023
- Activaciones: 5
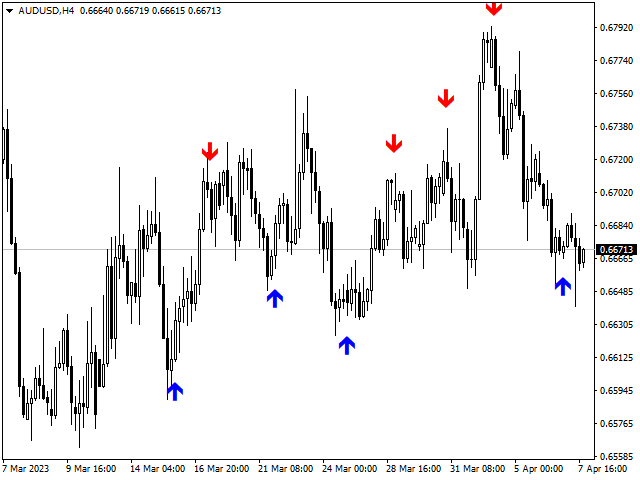
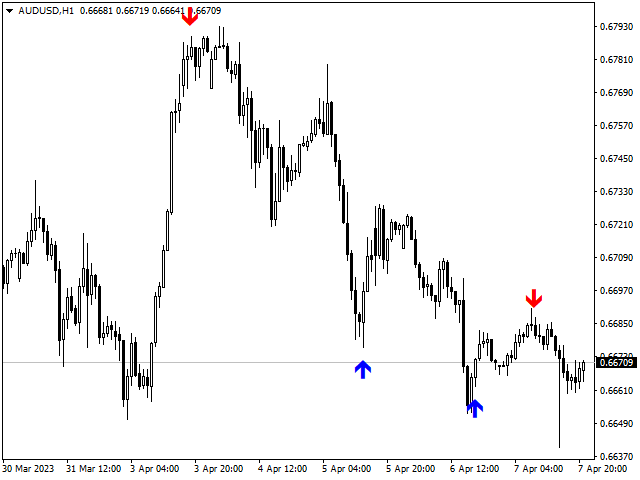
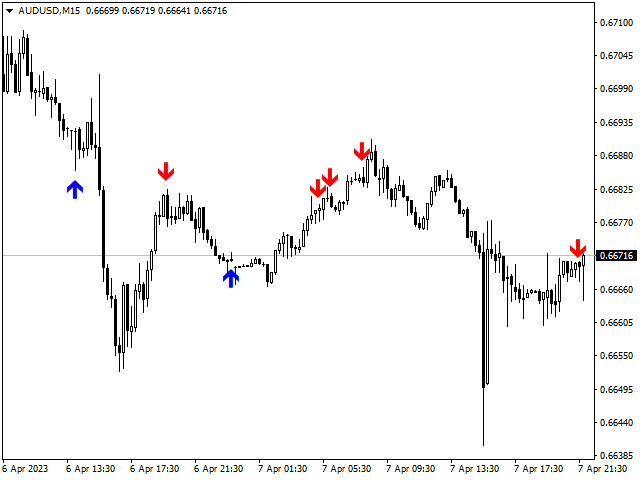
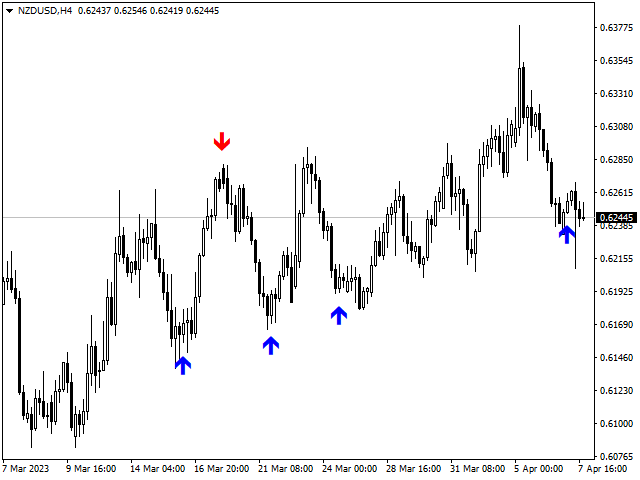
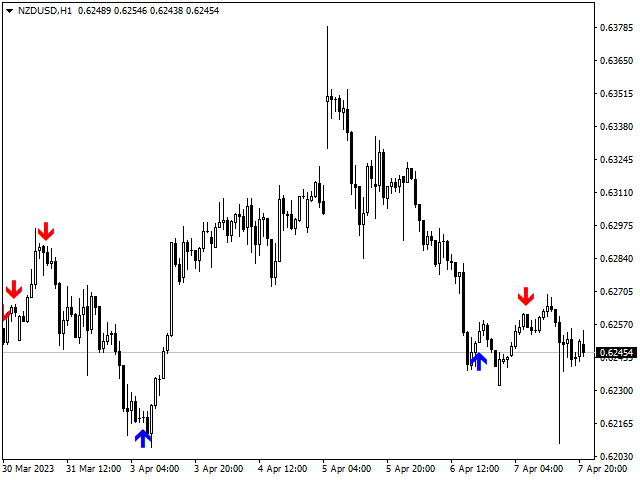
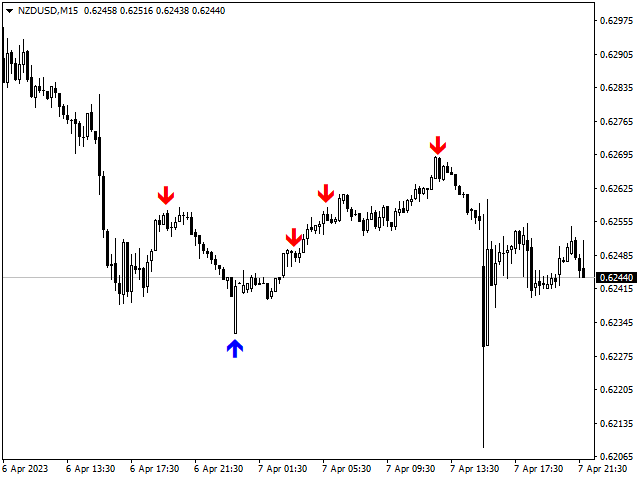
El indicador Volume Str es un indicador basado en los volúmenes de los ticks.
El propio nombre del indicador "Volume Street" indica la utilización y ordenación de los volúmenes
de acuerdo con un determinado algoritmo, lo que conduce a un buen resultado en la salida.
Mire las capturas de pantalla y verá qué señales da.
El indicador no se redibuja y puede utilizar sus señales después del cierre de la primera barra.