WaveTrend WT
- Indicadores
- Versión: 1.1
- Actualizado: 20 febrero 2023
- Activaciones: 5

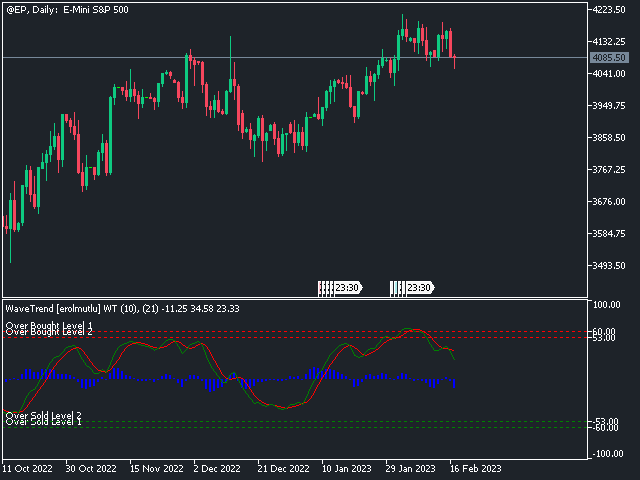
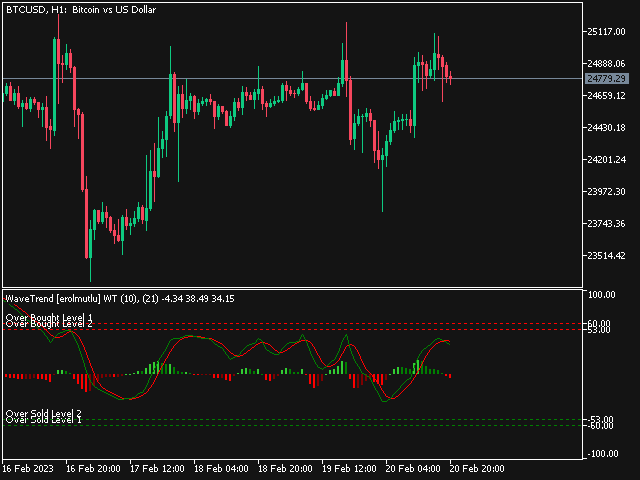
Oscilador que muestra los cambios de precios e identifica las zonas de sobrecompra y sobreventa. También puede mostrar puntos de cambio de tendencia.
El oscilador WaveTrend es una adaptación del famoso indicador TS /MT.
Cuando el oscilador está por encima de la banda de sobrecompra (líneas rojas) y cruza hacia abajo la señal (línea continua), suele ser una buena señal de VENTA. Del mismo modo, cuando el oscilador cruza por encima de la señal cuando está por debajo de la banda de sobreventa (líneas verdes), es una buena señal de COMPRA.
Buena suerte.