
Historical Memory B150
- Indicadores
- Versión: 3.2
- Actualizado: 9 agosto 2020
- Activaciones: 20
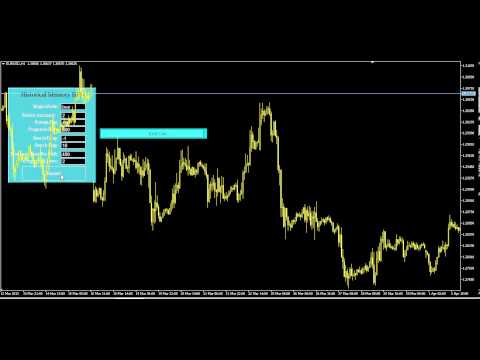
El modelo B150 es una versión totalmente revisada del indicador de Memoria Histórica con un algoritmo significativamente mejorado. También cuenta con una interfaz gráfica que hace que trabajar con esta herramienta perfecta sea rápido y cómodo.
Indicador-pronosticador. Muy útil como asistente, actúa como punto clave para pronosticar el movimiento futuro de los precios.
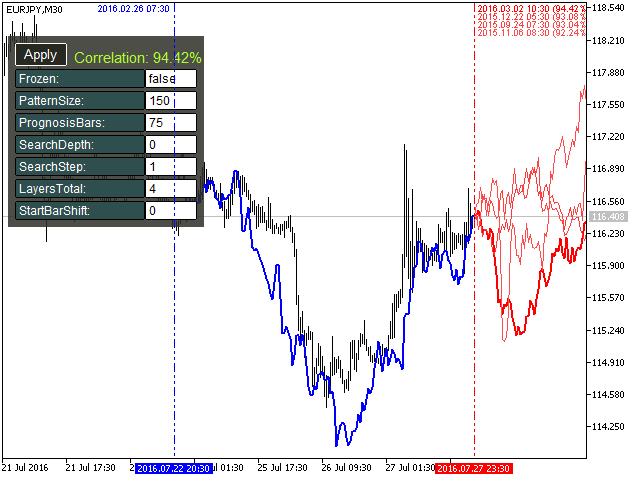
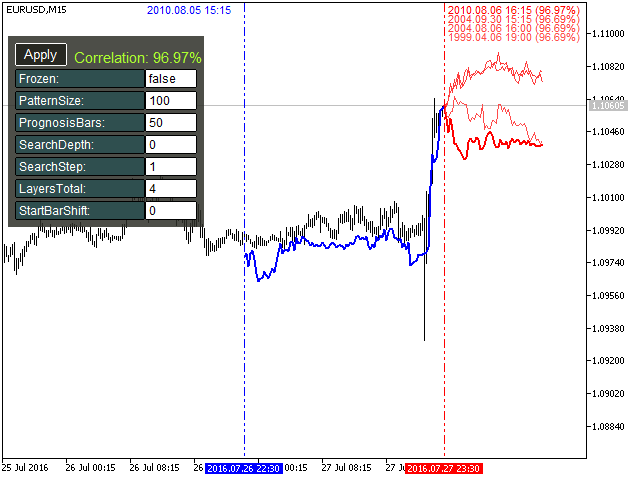
El pronóstico se realiza utilizando el método de búsqueda de la parte más similar en la historia (patrón). El indicador se dibuja como una línea que muestra el resultado del cambio del precio de cierre de las barras. Ahora puede encontrar y comparar visualmente la calidad de un patrón histórico con un patrón real. Además, el indicador es capaz de pronosticar analizando varios patrones a la vez.
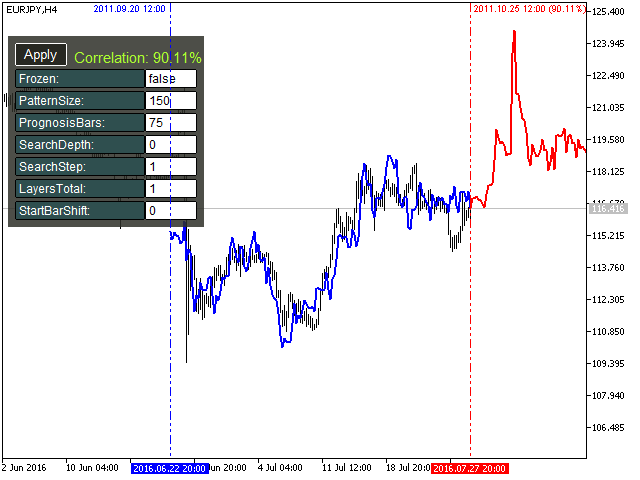
Parámetros de entrada
Pronóstico
- Congelar Predicción - permite congelar la predicción mostrada.
- Modo de visualización de capas - modo de visualización de capas: SHOW_ALL_LAYERS - todas las capas se mostrarán como líneas separadas; SHOW_AVERAGE - una vista multicapa como una línea suavizada.
- Show All Backward Lines - se mostrarán las líneas hacia atrás de todas las capas.
- Patrón: Tamaño(en compases)[1...] - el tamaño del patrón en compases.
- Predicción: número de barras [1...] - el número de barras utilizadas para la predicción.
- Búsqueda: profundidad del historial(en compases)(0 - todos los compases) - la profundidad del historial utilizada para buscar la mejor correlación.
- Búsqueda: Paso (en compases) - paso de búsqueda: el valor de paso más alto proporciona una mayor velocidad con una menor calidad de búsqueda.
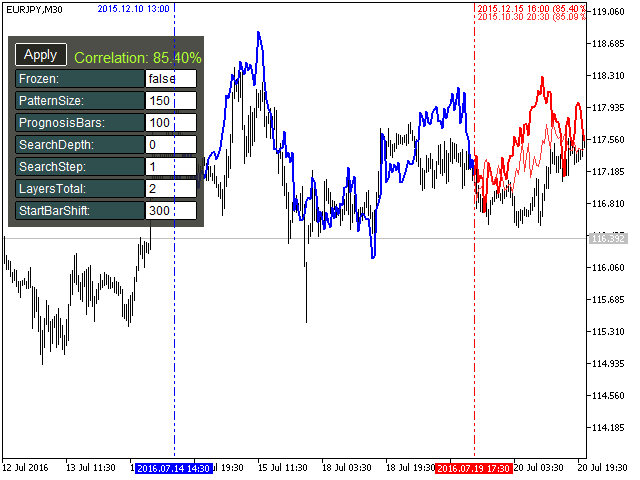
- Predicción: Capas totales [1...20] - número de capas: cuantas más capas, mayor variabilidad de la predicción.
- Búsqueda: Desplazamiento de la barra de inicio (en el historial) - desplazamiento de la barra a partir de la cual comienza la previsión.
Gráficos
- Prefijo del nombre de los objetos - prefijo del nombre de los objetos gráficos.


Love it, would be great if it could grab data from other instruments too on your watchlist for a bigger pool of patterns. Would be sick if it had the option.