
Historical Memory B150
- 지표
- 버전: 3.2
- 업데이트됨: 9 8월 2020
- 활성화: 20
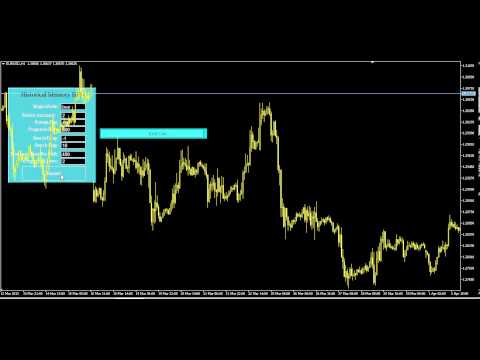
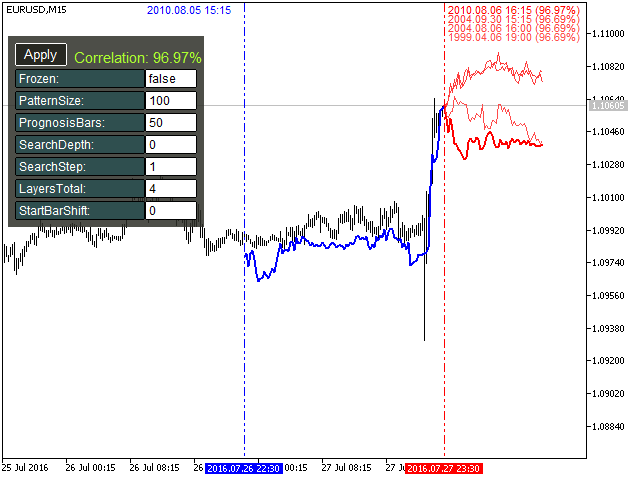
The B150 model is a fully revised version of the Historical Memory indicator with a significantly improved algorithm. It also features a graphical interface what makes working with this perfect tool quick and convenient.
Indicator-forecaster. Very useful as an assistant, acts as a key point to forecast the future price movement.
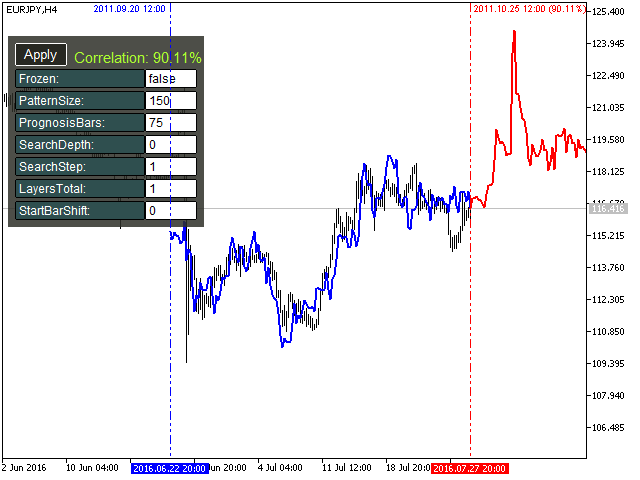
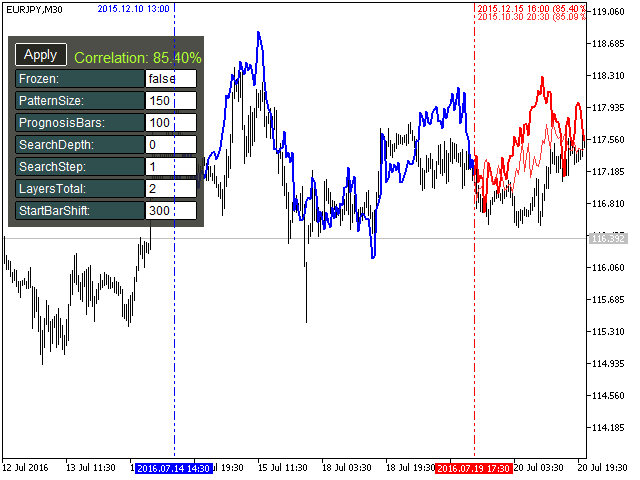
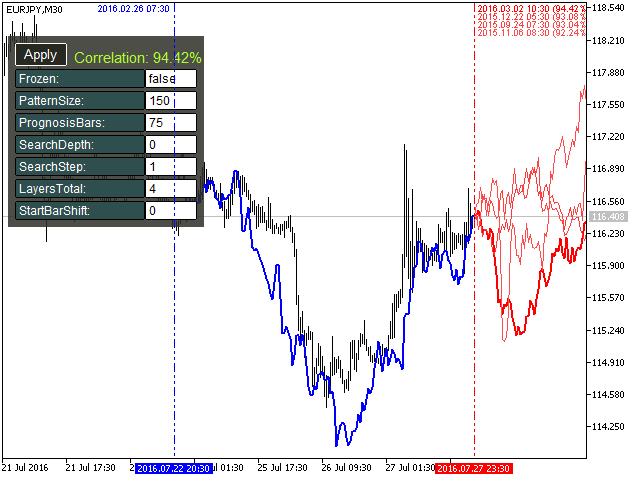
The forecast is made using the method of searching the most similar part in the history (patter). The indicator is drawn as a line that shows the result of change of the close price of bars. Now you can visually find and compare the quality of a history pattern with an actual pattern. In addition, the indicator is capable of forecasting by analyzing several patterns at once.
Input parameters
Forecast
- Prediction Freeze - allows to freeze displayed forecast.
- Layers Show Mode - layer display mode: SHOW_ALL_LAYERS - all layers will be shown as separate lines; SHOW_AVERAGE - a multi-layer view as a smoothed line.
- Show All Backward Lines - backward lines of all layers will be displayed.
- Pattern: Size(in bars)[1...] - the size of the pattern in bars.
- Prediction: the number of bars [1...] - the number of bars used for the forecast.
- Searching: depth of history(in bars)(0 - all bars) - the depth of the history used to search for the best correlation.
- Searching: Step(in bars) - search step: the higher step value provides a higher speed with a lower search quality.
- Prediction: Layers total [1...20] - the number of layers: the more layers, the greater the variability of the forecast.
- Searching: Start bar shift (in history) - shift of the bar from which the forecast begins.
Graphics
- Objects Name Prefix - prefix name of the graphic objects.


Love it, would be great if it could grab data from other instruments too on your watchlist for a bigger pool of patterns. Would be sick if it had the option.