Binary Wave Advance
- Indicadores
- Versión: 2.5
- Actualizado: 24 diciembre 2022
- Activaciones: 5

Actualización 2.2: Añadido MFI con mod predictivo. Actualizado todos los indicadores para reflejar valores similares, para combinar múltiples para descansar bien en las líneas de sobrecompra/sobreventa.
Actualización 2.3: Corrección de errores menores.
Actualización 2.4: Eliminados indicadores buggy DeMarker, y MACD, ya que era demasiado complicado y no tan preciso como el resto debido a su naturaleza. Añadido Awesome Oscillator. eliminado spreads, ya que empantanaba el indicador. Añadidas otras características, como los compensadores de valor de los indicadores para igualar los niveles de cada uno cuando se combinan.
Actualización 2.5: Añadido Oscilador Estocástico. Añadidos factores de compensación a todos los indicadores. Añadida la posibilidad de cambiar los Métodos MA de Señal para todos los indicadores. Añadido suavizado a algunos. Un poco más complicado, a menos que se acerque a cada indicador luego combinar.
Indicador de Onda Binaria que utiliza lo que creo que son la combinación más fiable. También he cambiado la forma en que el 2 de los indicadores de trabajo individual para tener un comportamiento predictivo: cambiar el período de señal en el MACD y Chariots(Osos y Toros) Poder alterará ligeramente esta capacidad. 5 parece ser el período con rendimientos decrecientes en Timeframes más rápidos. He notado que sobre un período de 100 operaciones en el gráfico M1, esto podría ahorrarme perder 1 pip por operación, así que 100 pips. en el gráfico M30 es alrededor de 8-10 pips por operación extra en la línea de cruce 0. También cambié el código en ADX y DeMarker para ser Lineal Ponderado, no Exponencial o Simple.
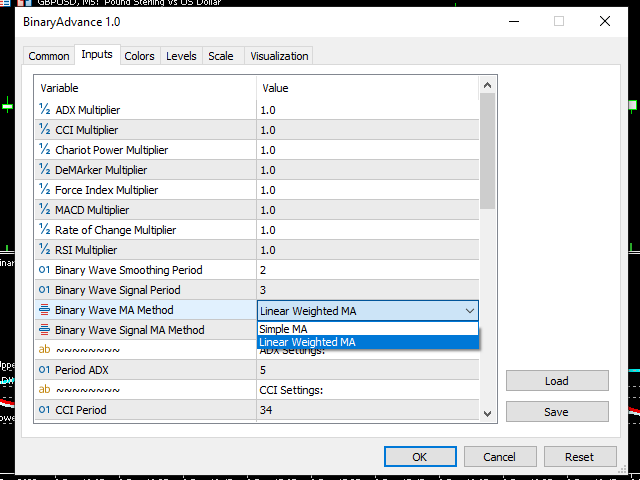
Usted puede suavizar la Onda Binaria Principal y elegir entre los métodos Simple o Lineal. También puede hacer lo mismo para la línea de Señal.
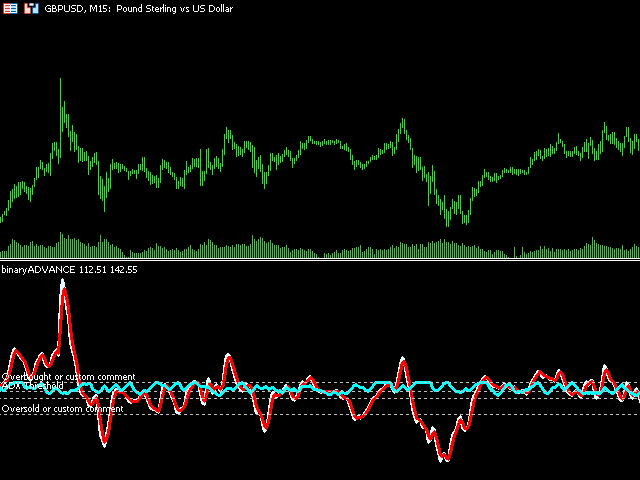
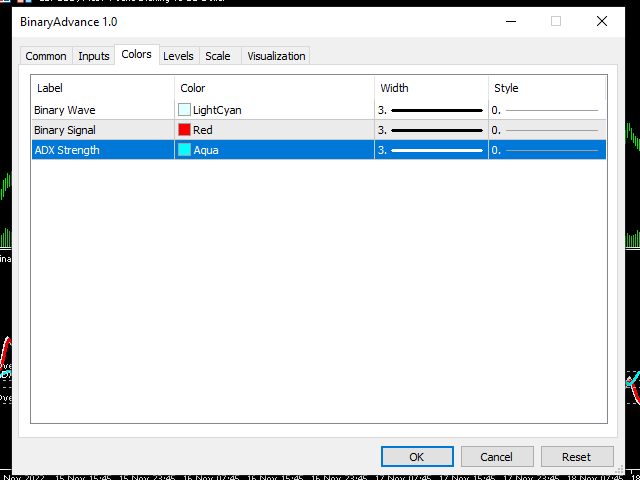
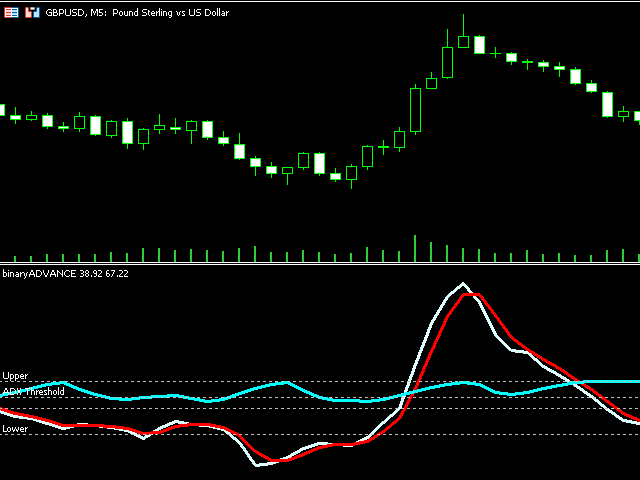
He trazado la línea principal ADX por separado (el DI_ y DI+ todavía se calculan en la Onda) en el gráfico para que pueda utilizar un solo gráfico para Volumen, Fuerza, Rango, Tendencia, Fuerza, etc, por lo que no hay necesidad de un gráfico ADX por separado.
Cosas que he notado usando este indicador: Cuando se sube a marcos de tiempo más lentos, el volumen calculado por barra se multiplica en gran medida, y el peso en los indicadores afectados por el Volumen tendrá que ser bajado, o los niveles ajustados(La línea ADX se vuelve inexistente-muy pequeña por lo que un gráfico ADX separado podría ser útil).
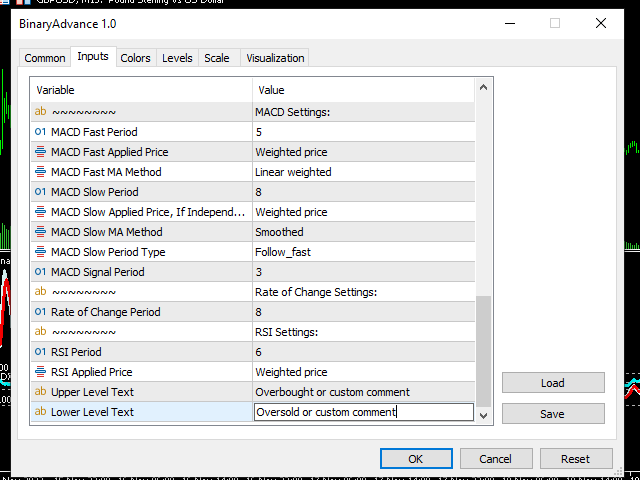
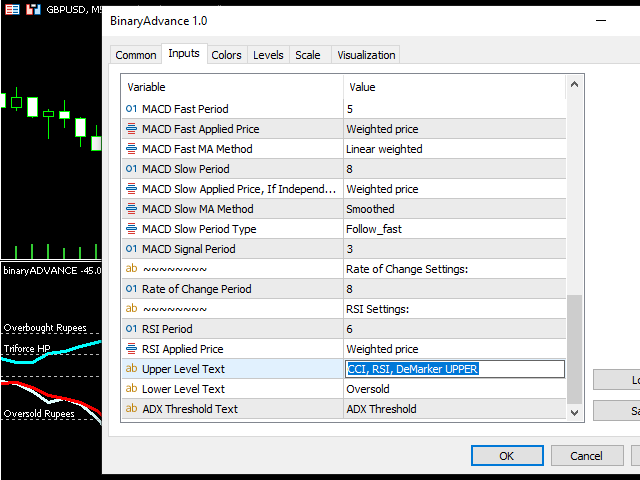
He mejorado la funcionalidad del MACD haciendo que los periodos Rápido y Lento sean independientes uno del otro, o que el Lento siga al Rápido, como colocar una segunda MA en un gráfico y cambiar su precio al valor del "Indicador Previo". También puede cambiar el método de MA para ambos, y el precio para ambos si la Señal está configurada como Independiente.
Cómo puede utilizar este indicador:
El nivel ADX permanece en el gráfico, independientemente del valor del multiplicador de peso. Usted podría utilizar los otros indicadores de forma independiente, y todavía tienen que ADX umbral para ayudar en un solo gráfico. Usted podría combinar algunos de sus indicadores favoritos, también. Puede utilizar el principio básico Binario del cruce de la línea Cero, o utilizar el cruce de la Onda sobre la Señal. A la línea de señal se le puede dar un periodo grande y utilizarla para determinar la dirección de la tendencia, la fuerza depende de la distancia de la Onda/línea principal. Además, cuando la línea ADX está por encima de un cierto nivel, es una buena señal. Pero es una señal aún mejor cuando empieza a caer. La onda está destinada a cruzar la señal en cualquier momento después de eso. (¡Mire el logotipo, por ejemplo!). La actualización 1.2 incluye una señal para facilitar la detección.
Indicadores disponibles para mezclar y combinar:
- ADX (Average Directional Index) - mod principal ADX Lineal Ponderado y mod Predictivo
- Awesome Oscillator - mod predictivo
- CCI (Commodity Channel Index) - mod predictivo y mod suavizador
- Oscilador Chaikin - mod predictivo
- Force Index - mod predictivo y mod de suavizado
- MFI (Money Flow Index) - Mod. predictivo y suavizado
- RSI (Relative Strength Index) - Mod. predictivo y suavizado
- Oscilador Estocástico - Mod. predictivo
- TRIX (Triple Exponential Average) - Mod predictivo
¡Gracias y buena suerte en tu búsqueda, viajero/comerciante! Que la Trifuerza te acompañe.
palabras clave adicionales: level levels reversal signal oscillator pivot moving average ma sma smma ema dema tema smoothing smooth simple el indicador más impresionante, nunca. USD JPY XAU oro plata GBP EUR.