CT Currency Strength
- Indicadores
- Versión: 1.0
- Activaciones: 5

Critical Trading, Fuerza de la Divisa
Este indicador permite ver los cambios de valor real en las 8 divisas principales, esta capacidad tiene muchas aplicaciones para el comercio de divisas simple y avanzado. No es necesario cambiar a aplicaciones o sitios web inexactos de terceros.
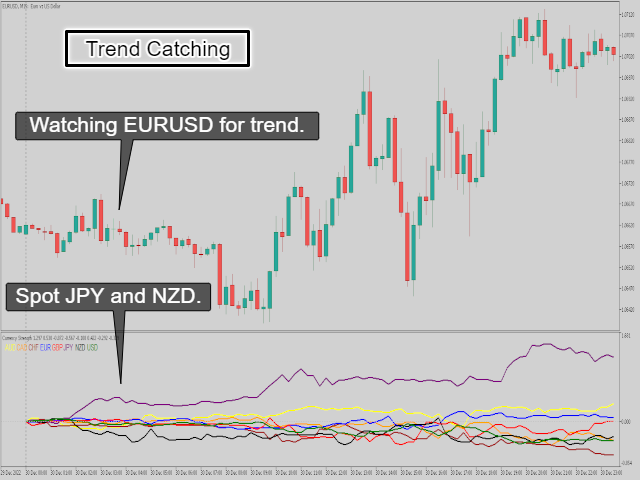
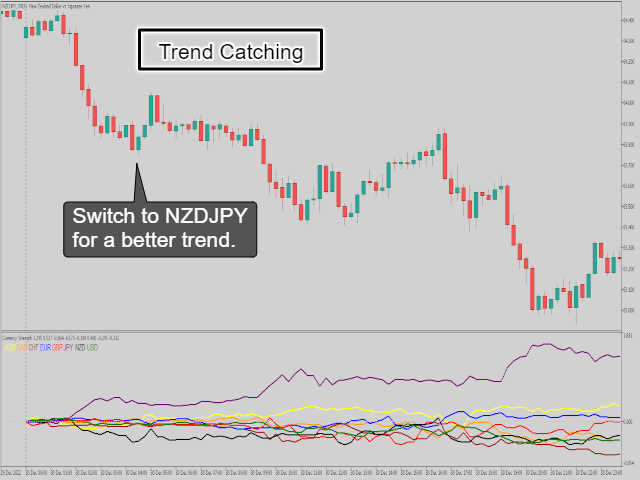
- Captura de tendencias: No hay necesidad de mirar 28 gráficos, empareje los pares de rendimiento más fuerte y más débil.
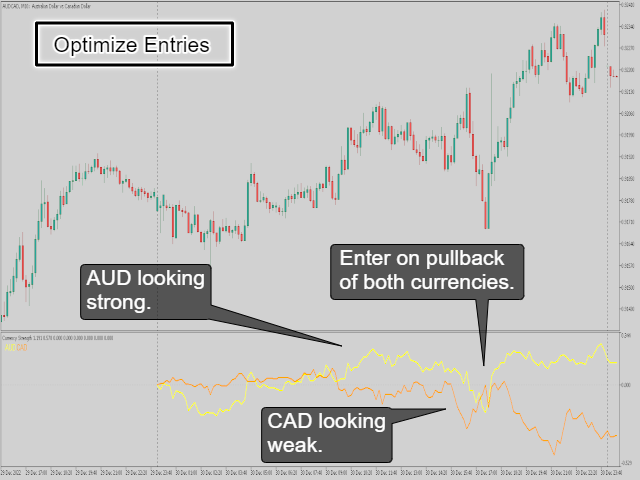
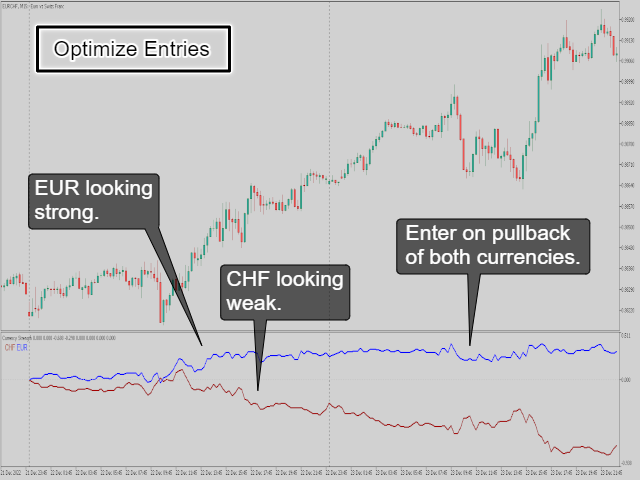
- Optimice las entradas: Muestre las divisas de su gráfico actual y entre en pullbacks fiables para una mayor confluencia en sus operaciones.
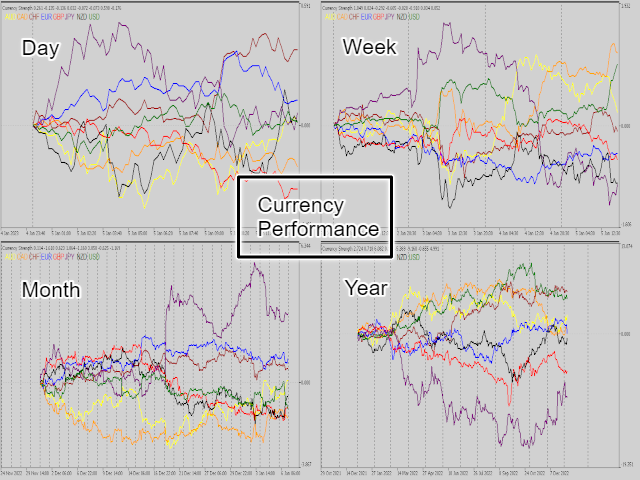
- Rendimiento de las divisas: Vea el rendimiento de las divisas en cualquier periodo de tiempo. Adjunte múltiples en un gráfico con diferentes marcos temporales para una correlación de tendencias en múltiples marcos temporales.
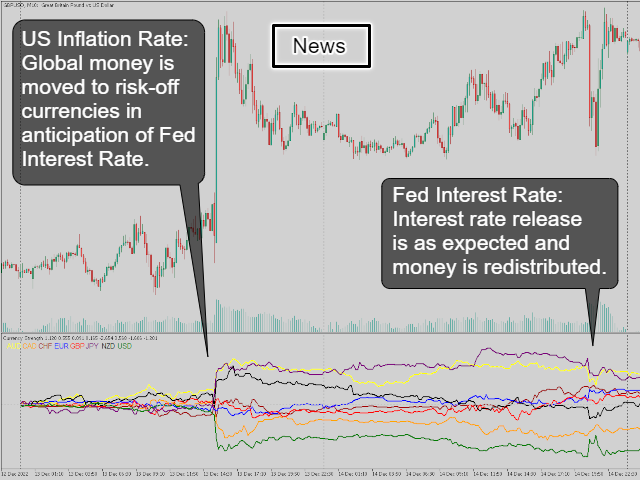
- Efectos de las noticias: Vea qué divisas se compran antes de una noticia importante y el efecto después de su publicación.
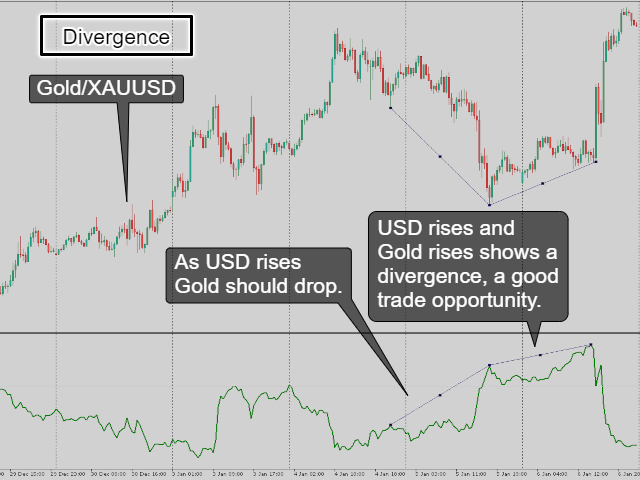
- Operaciones de divergencia: Utilice la divergencia en activos con fuerte correlación con el USD.
Estas son sólo algunas aplicaciones del análisis de la fortaleza de las divisas.
Adjúntelo a un gráfico, elija su método temporal (un periodo determinado de barras o una fecha de inicio), elija las divisas que desea seguir (todas por defecto), y listo.
Nota: El indicador utiliza datos de 28 símbolos y dependiendo de su período de tiempo elegido, la configuración de barras máximas y la velocidad de Internet puede tomar algún tiempo para volver a calcular hasta que sea preciso.
Nota: Debido a que el indicador utiliza datos de múltiples símbolos y a la forma en que operan los indicadores de MT5, puede ser difícil utilizar este indicador durante un mercado cerrado. Puede ser forzado cambiando entre marcos de tiempo hasta que se estabilice.
Nota: Actualmente el indicador sólo acepta símbolos en el formato estándar de EURUSD, AUDJPY etc. Póngase en contacto con criticaltrading@outlook.com para solicitar la adición de formatos no estándar.
Contacte con criticaltrading@outlook.com para más información o para solicitar cualquier otra funcionalidad.