Time Line by MMD MT5
- Indicadores
- Versión: 1.0
- Activaciones: 5
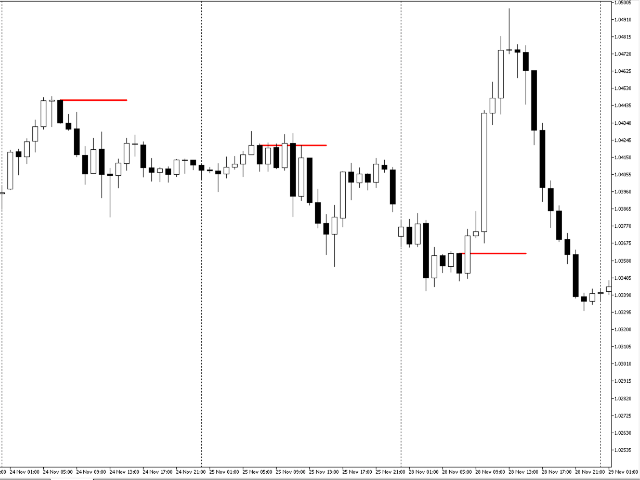
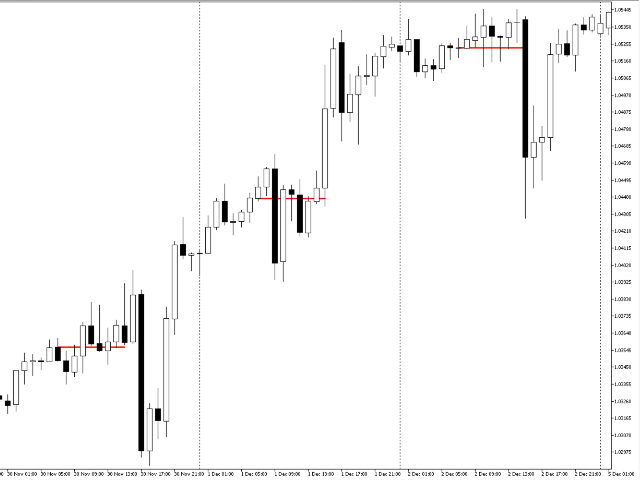
Time Line by MMD es un indicador simple que apoya el análisis de datos históricos y el trading en modelos estadísticos que siguen la metodología MMD.
Hora de inicio - especificación de la hora en la que empezamos a analizar y jugar con el modelo estadístico MMD
Time Duration en minutos - duración del modelo y su mayor efectividad (después del final de la línea, el precio vuelve - estadísticamente - al nivel establecido)
Lookback days - el número de días hacia atrás, sometidos al análisis histórico
Base Time Frame - intervalo de tiempo base a partir del cual se recogen los datos para determinar el inicio del modelo
Estilo de línea - estilo de línea
Color de línea - color de línea
Line Width - grosor de línea