Risk Reward Ratio with TP SL Boxes
- Indicadores
-
Filip Valkovic
 Founder of XraiderStudios (connect via fiverr.com)
Developer - Trader - Professor
Feel free to contact me with request about a job for MT4/MT5.
I specialize in converting tradingview scripts to metatrader. - Versión: 1.30
- Activaciones: 20
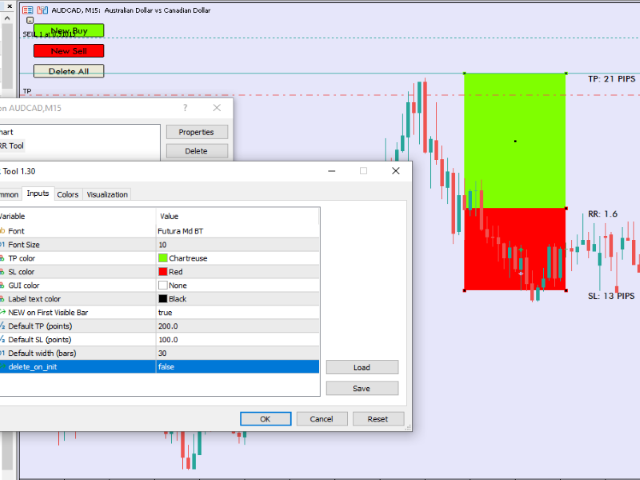
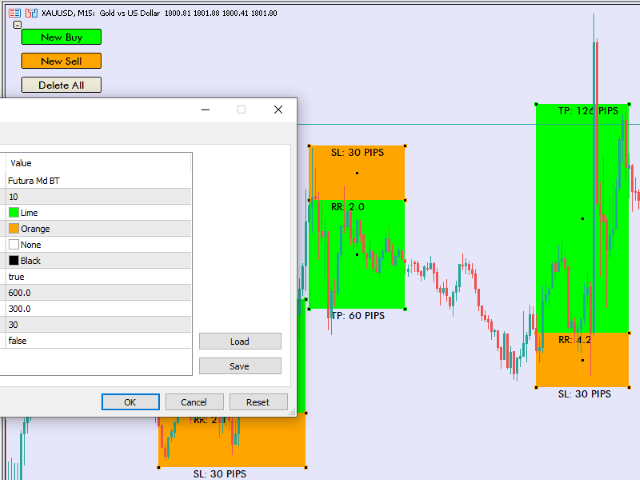
HERRAMIENTA RISK TO REWARD para MT5 con UI en el gráfico: (crea cajas RR similares como en tradingview)
-crea y borra cuadros arrastrables en el gráfico, CUALQUIER SÍMBOLO, CUALQUIER TF. Botones de menú:
NUEVA COMPRA, NUEVA VENTA, BORRAR TODO, ( y minimizar)
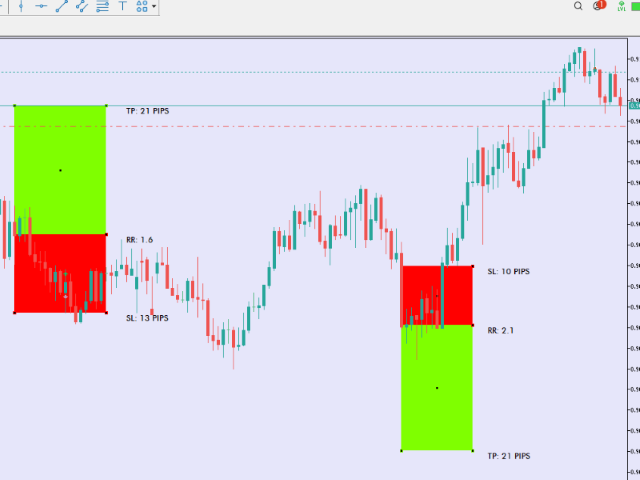
-nivel objetivo TP arrastrable-nivel límite SL arrastrable
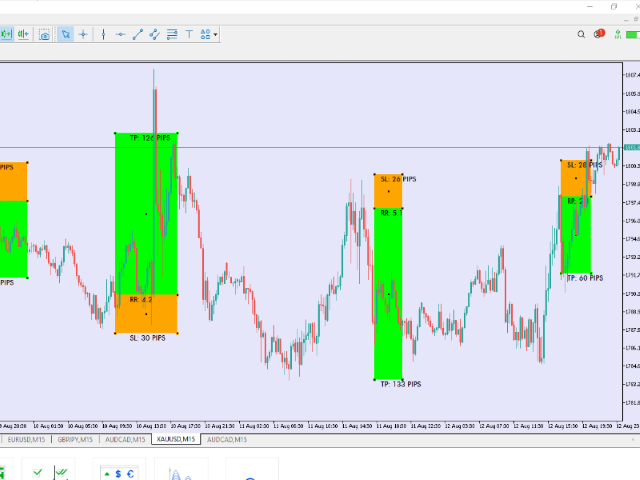
-etiquetas de texto con pips SL TP, ratio RR-no hay límite de cajas
-Hay un parámetro "delete_on_init" así que false = cada caja creada se queda como está, true = todo se borra cuando se cambia cualquier parámetro.
Cajas: -escalacon el cambio de marco de tiempo del gráfico
existen en duplets. Arrastrando una caja se moverá la segunda después de arrastrarla.
-Las cajas tienen 5 puntos de anclaje.
-El PUNTO MEDIO es para mover la caja.
-Los puntos de las esquinas son para redimensionar la caja.
-Mientras se redimensiona, hay un "número de puntos" (=pips*10) visible en la esquina de la caja, este número es igual al tamaño de la caja actual así que es el tamaño TP o SL en puntos.
-Doble click en el PUNTO MEDIO oculta todos los puntos y fija la caja. Doble click en el medio de nuevo para mostrar los puntos de nuevo y permitir mover/editar la caja.
-Borrar uno a uno = click derecho en cualquier punto => seleccionar borrar.
Parámetros de entrada:
fuente - define la fuente para las etiquetas de texto en el gráfico
tamaño de fuente - tamaño de las etiquetas de texto
TP Color - color de los cuadros que muestran el nivel de tp
SL Color - color de las casillas que muestran el nivel sl
GUI Color - color del fondo GUI (menú)
Color del texto de la etiqueta
NUEVO en la primera barra visible
- cuando esto es TRUE, las cajas son añadidas en la primera barra que es actualmente visible en el gráfico (lado izquierdo del gráfico) y el precio es el valor medio del gráfico.- cuando es FALSE, las cajas se añaden en la última barra actual con el último precio actual para el gráfico ( extremo derecho del gráfico)
Default TP - Nivel de TP utilizado al crear todas las cajas nuevas
Default SL - Nivel SL utilizado al crear todos los nuevos cuadros
Anchura por defecto - anchura utilizada para todas las nuevas cajas
delete_on_init - false = todos los cuadros creados permanecen como están al cambiar la configuración del gráfico o del indicador, true = todo se borra al cambiar cualquier parámetro.
(De lo contrario, es posible eliminar los cuadros haciendo clic derecho sobre ellos y haga clic en "eliminar", elimina sl, tp, y el texto)
TAMBIEN CONSEJO si quiere que las etiquetas TP SL se dibujen fuera de las cajas solo intercambie el lado IZQUIERDO Y DERECHO de la caja.