TW79 Channel Signal Pro
- Indicadores
- Versión: 3.0
- Activaciones: 5

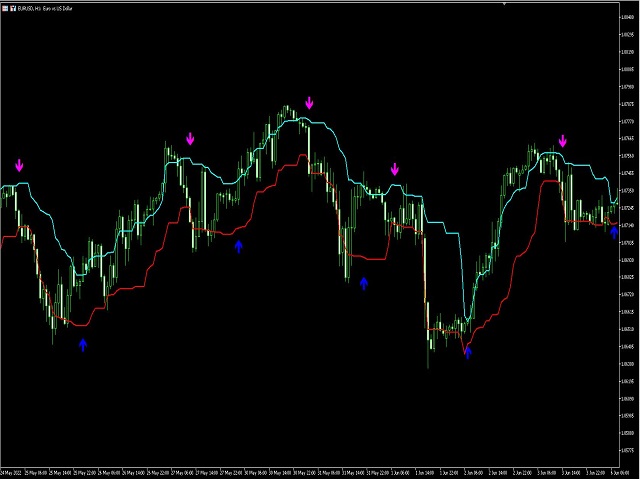
Este producto genera señales en las barras de cierre gracias al escalado de canales. Visualiza estas señales con una flecha. El color de la flecha indica la dirección de la operación. La configuración por defecto es válida para el periodo H1. Puede realizar backtest para cada periodo y producto. El contenido del código del indicador se ha aplicado de acuerdo con los movimientos de los precios en la medida de lo posible. Por esta razón, detecta bien los inicios y los finales de tendencia.
Descripción de los parámetros:
PER: Indica el número de barras a calcular.
PRO: Calcula el factor de expansión del canal.
Bexp: Debe estar a true cuando se llama al asesor experto.