Strong Move
- Indicadores
- Versión: 1.0

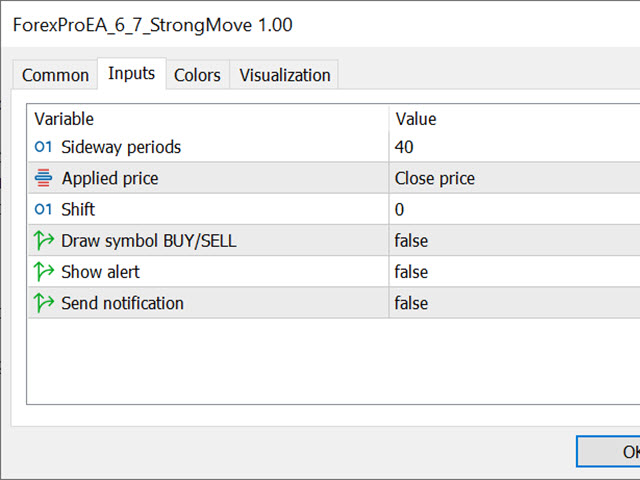
Este indicador combina RSI(14) y ADX(14) para encontrar la señal de que el precio se mueve con fuerza.
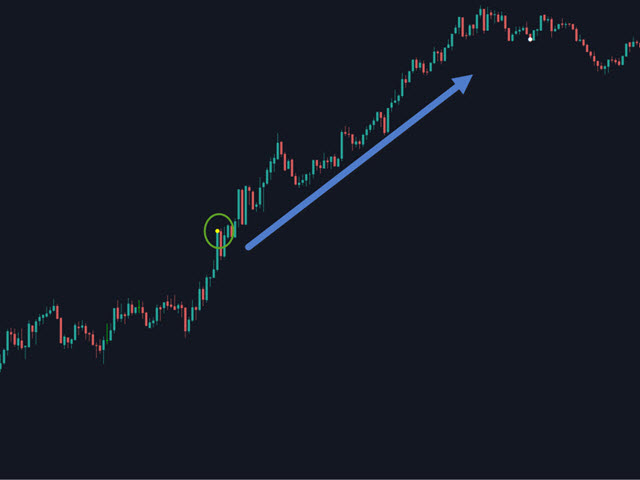
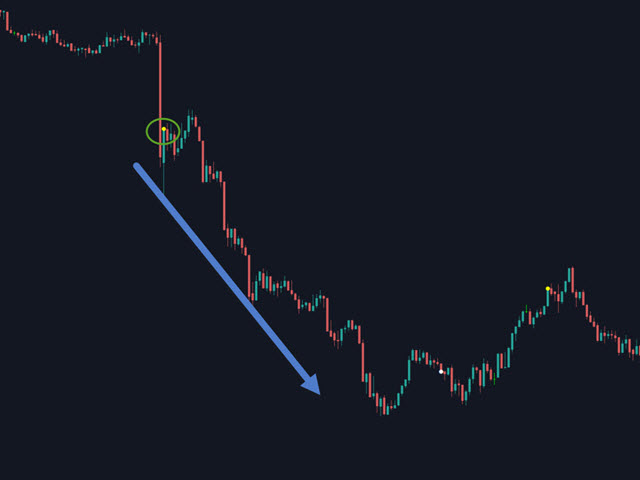
Cuando aparece la señal (representado por el punto amarillo), y el precio está bajando, vamos a considerar para abrir una orden de venta.
De lo contrario, considere abrir una orden de COMPRA.
En este caso, la fuerza del movimiento es fuerte (normalmente después de un periodo lateral), por lo que podemos establecer el TP en 3 veces el SL.