WindFlow HTF MT5
- Indicadores
- Versión: 2.10

WindFlow HTF es una herramienta útil y adecuada para utilizar junto con mi indicador WindFlow. Este indicador le dará una visión de fondo sobre la tendencia de la acción del precio en un marco de tiempo superior, por lo que cuando se ejecuta con el indicador WindFlow tiene una solución de trading casi completa. En este punto, sólo necesita un poco de análisis de soporte/resistencia y un poco de concentración para convertirse en un trader consistente.
El metafórico "ballet del viento".
Los operadores profesionales saben que cada marco temporal se rige por su propio "marco temporal superior significativo", pero al mismo tiempo este marco temporal superior se rige por su propio marco temporal inferior de forma interna; esto significa que el marco temporal superior llegará más tarde a los movimientos de impulso que su marco temporal inferior, pero al mismo tiempo cuando el movimiento se produce en el marco temporal superior es un movimiento significativo. Esto es un poco como el "ballet del viento" donde diferentes flujos direccionales se mezclan para formar turbulencias o momentos de calma pero cuando la calma es demasiado larga y extraña, ¡tarde o temprano habrá una gran tormenta! He estudiado estos conceptos durante años y nunca dejan de fascinarme: los operadores del mercado se comportan como las fuerzas de la naturaleza, ¡es un concepto impresionante! Además, si conoces a Fibonacci (alias Leonardo Pisano, un genio matemático italiano) descubrió una secuencia que se da muy a menudo en la naturaleza, igual que en los mercados financieros.
Ahora, surge una pregunta: ¿por qué los comerciantes (especialmente los novatos) a menudo tienen dificultades para ser consistentemente rentable? Bueno, muchas veces (casi siempre), esto ocurre porque no son conscientes del tipo de mercado; ¿es oscilante o tendencial? ¿Es tranquilo o volátil? La capacidad de detectar el tipo de mercado correcto es vital para su trabajo como operador, al igual que las condiciones del terreno son vitales para el éxito de los coches de carreras. " Esperar que el mismo sistema funcione en todos los tipos de mercado es la definición de locura" esta es la frase de un gran psicólogo del mercado Van Tharp en el libro financiero "Market Wizards".
Características principales
- Basado en la dinámica de la tendencia WindFlow (sin cálculo de momentum/volatilidad sino sólo dirección de tendencia significativa)
- Muy útil para el análisis técnico
- Funciona en todos los símbolos y marcos temporales
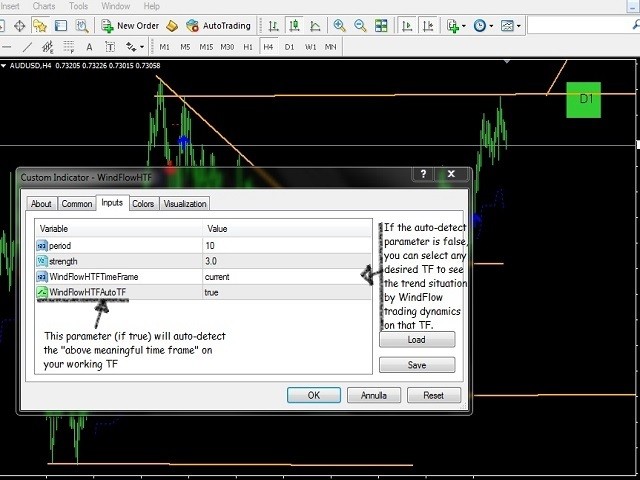
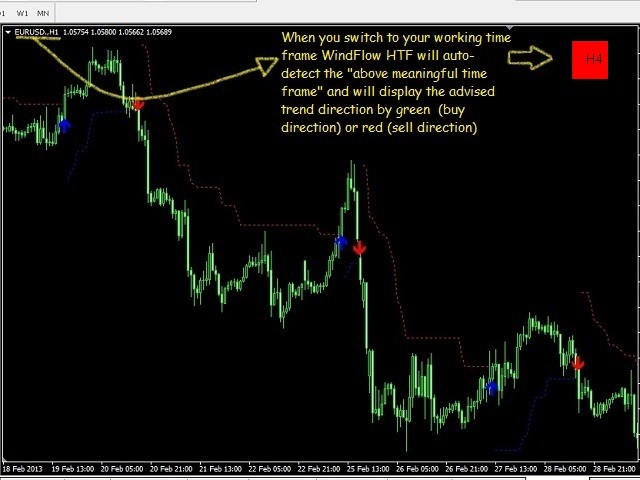
- Uso opcional de la autodetección "por encima del marco temporal significativo" o elección manual del marco temporal
Entradas
- period: periodo del indicador
- fuerza: fuerza del indicador
- WindFlowHTFTimeFrame: permite seleccionar el TF deseado para mostrar la dinámica de la tendencia (si WindFlowHTFautoTF es falso)
- WindFlowHTFautoTF (true/false): habilita o deshabilita la autodetección del "marco temporal por encima del significativo"
- LoockBackBars: cuántas barras se miran hacia atrás para los cálculos (100 por defecto es suficiente para tener cálculos correctos)