Fast trade detector
- Indicadores
- Versión: 1.11
- Activaciones: 5

Fast Trade Detector (FTD) - El indicador más veraz que muestra el verdadero estado de ánimo
del Gran Jugador.
Hay un Jugador en la bolsa que lo tiene todo para estar en lo más alto del libro de órdenes
(pila de la bolsa). Estas operaciones son como un indicador del estado de ánimo del mercado de un Jugador fuerte.
Te darás cuenta de que las cosas no son como te las imaginabas antes. Descubrirá algoritmos y estrategias
de un participante importante del mercado.
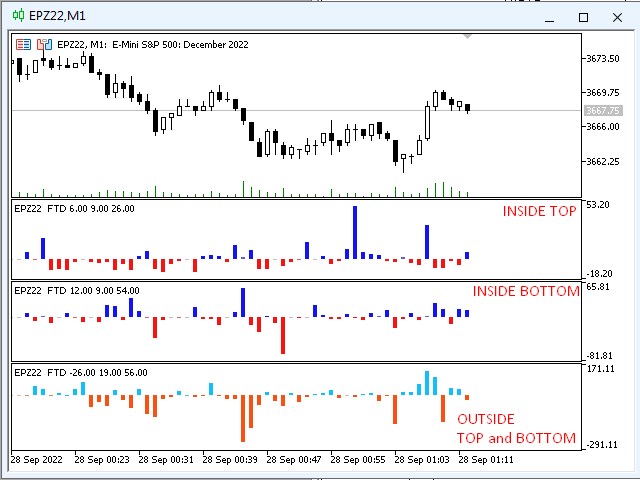
El rendimiento del indicador en forma de histograma en el sótano del gráfico. El histograma toma
valores positivos(compra) y negativos(venta).
El indicador distingue dos tipos de operaciones - INSIDE ( entrada en el mercado) y OUTSIDE ( salida del mercado).
Según un determinado algoritmo en el flujo de ticks se seleccionan los bloques superior e inferior, operaciones en las que
son"TOP" y"BOTTOM" respectivamente.
Estimamos el equilibrio de fuerzas mediante operaciones INSIDE, por separado TOP y BOTTOM.
Estimamos las salidas del mercado mediante operaciones OUTSIDE, conjuntamente TOP y BOTTOM.
Las operacionesOUTSIDE son en su mayoría stops, por lo que se muestran aquí tal cual. Es decir, los vendedores débiles
salen del mercado comprando, y los compradores débiles - vendiendo.
En total, necesitamos tres histogramas para trabajar - INSIDE TOP, INSIDE BOTTOM, OUTSIDE TOP&BOTTOM.
Nuestro trading se basa en el principio de seguir al gran jugador.
FTD nos permitirá seguir las"grandes" operaciones.
Se ha revelado cierta peculiaridad en el flujo de ticks de las operaciones.
Las operaciones TOP son predominantemente compras y las BOTTOM son predominantemente ventas.
Esto, creo, es debido a la construcción de algoritmos de negociación de lado fuerte (un tema aparte para la discusión).
Esto sólo se aplica a las operaciones INSIDE. Las operaciones OUTSIDE suelen ser, respectivamente,
TOP - compras (salidas de vendedores), BOTTOM - ventas (salidas de compradores).
Nos interesan las situaciones, en las que los histogramas INSIDE TOP o INSIDE BOTTOM serán de la misma dirección (compra o venta).
Las configuraciones más fáciles de realizar para la continuación del movimiento cerca de los extremos locales.
La mayoría de las veces se espera un rebote de las líneas de soporte (resistencia) y el movimiento en la dirección opuesta.
Tales operaciones suponen un stoploss corto y, por lo tanto, son más interesantes para el público.
Si, por ejemplo, el precio llega con compras (fuertes) a la parte superior, en la que hubo fuertes compras, reforzará la señal.
Es útil observar esta situación desde el otro lado (débil). Todavía hay vendedores en esta cima y en la segunda aproximación
los vendedores empiezan a vender de nuevo. Los stops de estos vendedores están detrás del techo. Este es nuestro objetivo.
Las salidas del mercado se observan mediante operaciones EXTERIORES (compras en este caso).
Esto es sólo un ejemplo del uso del indicador FTD.
Lo descrito anteriormente es un clásico, algo que todo el mundo entiende. Pero, es sencillo cuando se conoce el equilibrio de poder.
El indicador FTD le ayudará en esto. No pretende ser un análisis cuantitativo, sino más bien cualitativo.
Con su ayuda podrá mirar al mercado con otros ojos y plantearse "grandes" estrategias.
Las pruebas se realizaron durante mucho tiempo en los futuros del índice S&P500.
El indicador funcionará con muchos otros instrumentos bursátiles.
Debido a las peculiaridades de los algoritmos internos, este indicador no funcionará en el mercado Forex.
Configuración del indicador:
- Mostrar historial. El número de minutos de la historia desde la hora actual.
- Que operaciones utilizar. INSIDE o OUTSIDE.
- Qué bloques utilizar. TOP o BOTTOM.
- Color del histograma para las compras. Azul por defecto.
- Color del histograma para las ventas. Por defecto rojo.
.