Fast trade detector

 Fast Trade Detector (FTD) - Самый правдивый индикатор, который показывает истинное
настроение Большого Игрока. 
На бирже есть Игрок, у которого есть всё для того, чтобы быть в первых рядах в книге торговых 
приказов (биржевом стакане). Эти сделки как индикатор рыночного настроения сильного игрока.
Вы поймёте, что всё не совсем так, как представляли раньше. Вам откроются алгоритмы и стратегии 
крупного участника рынка.

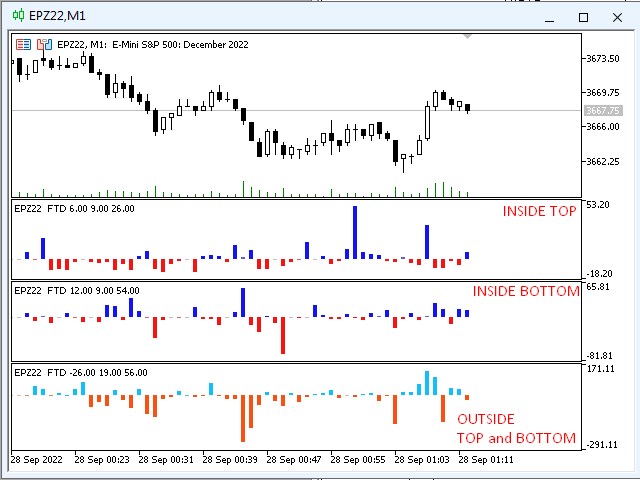
 Исполнение индикатора в виде гистограммы в подвале графика. Гистограмма принимает
положительные (покупки) и отрицательные (продажи) значения.

 Индикатор выделяет два типа сделок - INSIDE (входящие в рыноки OUTSIDE (выходящие из рынка).
По определённому алгоритму в тиковом потоке выделены верхние и нижние блоки, сделки в которых, 
соответственно, "верхние" (TOP) и "нижние" (BOTTOM). 

 Оцениваем расстановку сил по сделкам INSIDE, отдельно TOP и BOTTOM.
Выходы из рынка оцениваем по сделкам  OUTSIDE, совместно TOP и BOTTOM.
OUTSIDE сделки это чаще всего стопы, поэтому здесь показаны так как есть. То есть, слабые продавцы
выходят из рынка покупками, а слабые покупатели - продажами.
Итого для работы нужны три гистограммы - INSIDE TOP, INSIDE BOTTOM, OUTSIDE TOP&BOTTOM.

 Наша торговля ведётся по принципу следования за крупным игроком.
FTD позволит нам следить за "большими" сделками. 

 Выявлена некоторая особенность в тиковом потоке сделок.
Сделки TOP преимущественно покупки, а сделки BOTTOM - продажи.
Это, я думаю, связано с построением торговых алгоритмов сильной стороны (отдельная тема для обсуждения).
Это касается только сделок INSIDE. Сделки OUTSIDE как правило, соответственно,
TOP - покупки (выходы продавцов), BOTTOM - продажи (выходы покупателей).

 Нас интересуют ситуации, в которых гистограммы INSIDE TOP или INSIDE BOTTOM будут одного направления (покупки или продажи).
Самые простые в реализации сетапы на продолжение движения около локальных экстремумов.
Чаще всего ожидают отскок от линий поддержки (сопротивления) и движение в обратную сторону.
Такие сделки предполагают короткий стоплосс и, следовательно, более интересны для публики.
Если, допустим, цена подходит с покупками (сильными) к вершине, на которой были сильные же покупки, это будет усиливать сигнал.
 Полезно посмотреть на эту ситуацию с другой (слабой) стороны. На этой вершине остались продавцы и при повторном
подходе снова начинаются продажи. Стопы у этих продавцов за вершиной. Это наша цель.
Выходы из рынка наблюдаем по сделкам OUTSIDE (покупки в данном случае).

 Это просто пример использования индикатора FTD
Описанное выше - это классика, то что всем понятно. Но, это просто, когда вы знаете расстановку сил. 
Индикатор FTD поможет вам в этом. Он не претендует на количественный анализ, скорее на качественный.
С его помощью можно взглянуть на рынок другими глазами и рассмотреть "большие" стратегии.

 Тестирование долгое время проводилось на фьючерсе индекса S&P500.
Индикатор будет работать со многими другими биржевыми инструментами. 
Из-за особенностей внутренних алгоритмов данный индикатор не будет работать на рынке форекс. 

 Настройки индикатора:

  1. Показать историю. Количество минут из истории от текущего времени.
  2. Какие сделки использовать. INSIDE или OUTSIDE.
  3. Какие блоки использовать. TOP или  BOTTOM.
  4. Цвет гистограммы для покупок. По умолчанию синий.
  5. Цвет гистограммы для продаж. По умолчанию красный.
 Объёма обзора не хватит, чтобы описать все нюансы работы с индикатором.
В обсуждении буду делиться наработками и некоторыми приемами.
Produits recommandés
Easy Bands Mt5
Nikolay Kositsin
В основе индикатора EasyBands лежит тот же принцип, что и при построении Bollinger Band. Однако, данная модификация индикатора использует вместо стандартного отклонения средний торговый диапазон (Average True Range). Соответственно, с данныи индикатором абсолютно аналогично можно использовать все стратегии, которые применяются с Bollinger Band. В данной версии индикатора используется двенадцать уровней и средняя линия (белый цвет). Индикация тренда выполнена в виде окраски свечей в зависимости
ROMAN5 Time Breakout Indicator automatically draws the boxes for daily support and resistance breakouts. It helps the user identifying whether to buy or sell. It comes with an alert that will sound whenever a new signal appears. It also features an email facility. Your email address and SMTP Server settings should be specified in the settings window of the "Mailbox" tab in your MetaTrader 5. Blue arrow up = Buy. Red arrow down = Sell. You can use one of my Trailing Stop products that automatical
FREE
Urgently mt5
Tatiana Savkevych
The Urgently indicator is designed to quickly determine the situation in the market, reflect the state of the market and signal profitable levels for opening trades. Market conditions change quickly enough, requiring constant calibration of trading strategies. Recommended for use in conjunction with any of the oscillators. The Urgently forex market trend indicator shows the trend direction and entry points. It smooths out price fluctuations when generating a signal by averaging the data and the
PREngulfing
Slobodan Manovski
PR EA - Système de trading basé sur les motifs Engulfing Détection automatique des chandeliers Engulfing avec confirmation par moyenne mobile Le PR EA est un expert advisor pour MetaTrader 5 qui identifie et trade les motifs Engulfing haussiers/baissiers lorsqu'ils sont confirmés par un filtre de moyenne mobile. Optimisé pour le timeframe M30, compatible avec M15 et H1. Caractéristiques principales : Reconnaissance de motifs - Détecte les formations Engulfing valides Confirmation de tend
Universal Soul Reaper
Pieter Gerhardus Van Zyl
Universal Soul Reaper is an atmospheric market-flow oscillator designed to interpret price behavior as a cycle of spiritual energy. Instead of reacting to raw price alone, it visualizes the state of the market’s soul —revealing when momentum is awakening, stabilizing, or fading. The indicator operates in a separate window and presents three interwoven entities: the Ectoplasmic Veil , the Spirit Boundary , and the Soul Core . Together, they form a living framework that helps traders sense pressu
With this easy to set up indicator you can display and set alerts for the following candlestick formations: Bull Breakout, Bear Breakout, Hammer, Pin, Bullish Engulfing, Bearish Engulfing. Input parameters: ShortArrowColor: The color of the Arrows, displaying a Bearish candle formation LongArrowColor: The color of the Arrows displaying a Bullish candle formation BullishEngulfing: Disabled/Enabled/EnabledwithAlert BearishEngulfing: Disabled/Enabled/EnabledwithAlert Pin:  Disabled/Enabled/Enabledw
FREE
TransitBlueOcean
Bonginkosi Innocent Khumalo
5 (1)
TransitBlueOcean is indicator system that uses ocean wave's pattern, to help one to know when to buy and when to sell. The indicator system is very powerful like the ocean waves. Join the mql5 channel for TransitBlueOcean  https://www.mql5.com/en/channels/transitblueocean   How to use: Zoom in so that the Ocean will appear on your chart. Buy when you see the candles, the candle will be above the ocean wave (buying signal). Sell when you can't see the candles, the candles will be inside the wav
Mario Order Blocks
Sandeep Kumar Tiwary
Mario Order Block Indicator Overview The Professional Order Block Indicator is an advanced technical analysis tool that automatically identifies and displays institutional order blocks on your chart. Based on smart money concepts, this indicator helps traders identify high-probability support and resistance zones where institutional traders have placed significant orders. Key FeaturesAutomatic Order Block Detection Identifies bullish and bearish order blocks based on pivot point analysis Uses so
The Antique Trend Indicator is a revolutionary trend trading and filtering solution with all the important features of a trend tool built into one tool! The Antique Trend indicator is good for any trader, suitable for any trader both for Forex and binary options. There is no need to configure anything, everything has been perfected by time and experience, it works great during flats and trends. The Antique Trend indicator is a tool for technical analysis of financial markets, reflecting curren
No Wick Candle
Hafiz Anas Hashmi
5 (1)
No Wick Candles is a powerful price action indicator that identifies candles with no upper or lower wick (also known as Marubozu candles ) and automatically draws horizontal compensation lines from their open price with a "Compensation" label . These wickless candles represent strong momentum and are often used by professional traders as key support/resistance zones . The indicator helps you visualize potential reversal or continuation zones instantly. Key Features Detects Bullish (no lower wick
FREE
Introduction to the Manual Backtesting Indicator on MQL5 The MetaTrader platform provides an excellent backtesting tool for evaluating Expert Advisors (EAs). However, when it comes to manually backtesting a strategy to assess its effectiveness, this tool has some limitations: You cannot manually draw zones or trend lines while in backtesting mode. You cannot switch timeframes to check time alignment. For example, if my strategy requires additional confirmation from a higher timeframe (HTF), this
Ichimoku Aiko MTF
Michael Jonah Randriamampionontsoa
Ichimoku Aiko MTF is a collection of technical indicators that show support and resistance levels, as well as momentum and trend direction. It is a multi-timeframe indicator so you don't need to change the chart timeframe when you want to see the ichimoku clouds on a higher timeframe.  eg. The chart timeframe is M15 and you want to see on the M15 timeframe chart the H1 ichimoku indicators (the ichimoku in Metatrader can't do that) that's why you need to use Ichimoku Aiko MTF.
L'indicateur SMC Venom Model BPR est un outil professionnel pour les traders travaillant dans le concept Smart Money (SMC). Il identifie automatiquement deux modèles clés sur le graphique des prix: FVG   (Fair Value Gap) est une combinaison de trois bougies, dans laquelle il y a un écart entre la première et la troisième bougie. Forme une zone entre les niveaux où il n'y a pas de support de volume, ce qui conduit souvent à une correction des prix. BPR   (Balanced Price Range) est une combinaiso
Gecko EA MT5
Profalgo Limited
5 (1)
NEW PROMO: Only a few copies copies available at 349$ Next price: 449$ Make sure to check out our " Ultimate EA combo package " in our   promo blog ! Gecko runs a simple, yet very effective, proven strategy.  It looks for important recent support and resistance levels and will trade the breakouts.  This is a "real" trading system, which means it will use a SL to protect the account.  It also means it will not use any dangerous techniques like martingale, grid or averaging down. The EA shows its
Owl Smart Levels MT5
Sergey Ermolov
4.03 (32)
Version MT4   |  FAQ L' indicateur Owl Smart Levels est un système de trading complet au sein d'un seul indicateur qui comprend des outils d'analyse de marché populaires tels que les fractales avancées de Bill Williams , Valable ZigZag qui construit la structure d'onde correcte du marché et les niveaux de Fibonacci qui marquent les niveaux exacts d'entrée. sur le marché et les endroits où prendre des bénéfices. Description détaillée de la stratégie Mode d'emploi de l'indicateur Conseiller-Assis
Visual Momentum Wave Sync Indicator
AL MOOSAWI ABDULLAH JAFFER BAQER
Visual Momentum Wave Sync: Master Market Momentum with Unmatched Clarity Unlock the market's rhythm and trade with confidence for just $30! Are you tired of noisy indicators that clutter your charts and provide conflicting signals? Do you struggle to accurately gauge market momentum and identify high-probability entry and exit points? The Visual Momentum Wave Sync indicator is the definitive tool designed to solve these problems, offering a crystal-clear view of market dynamics for traders who
Flex Channel MT5
Aleksandrs Butrims
Flex channel - indicator plots channel using Hodrick-Prescott filter. Hodrick-Prescott filter is the method of avreaging time series to remove its cycling componets and shows trend. Settings HP Fast Period - number of bars to calculate fast moving average HP Slow Period - number of bars to calculate slow moving average Additional information in the indicator Channel width - channel width in pips at first bar MA position - fast moving average position in the channel in persentage Close position -
Elliott Wave Trend was designed for the scientific wave counting. This tool focuses to get rid of the vagueness of the classic Elliott Wave Counting using the guideline from the template and pattern approach. In doing so, firstly Elliott Wave Trend offers the template for your wave counting. Secondly, it offers Wave Structural Score to assist to identify accurate wave formation. It offers both impulse wave Structural Score and corrective wave Structure Score. Structural Score is the rating to sh
DR IDR Range Indicator PRO
Botond Doczy Rossler
5 (2)
The   DR IDR Range Indicator PRO  plots ADR, ODR and RDR ranges for a given amount of days in the past. A key feature that appears is that it calculates the success rate of the ranges for the shown days. This indicator is perfect for backtest since it shows ranges for all of the calculated days, not just the most recent sessions. In the PRO version you can now: use fully customizable advanced statistics to base your trades on get an edge via calculating statistics on up to 3 different day period
Stormer RSI 2
Ricardo Rodrigues Lucca
This strategy was learned from Stormer to be used on B3. Basically, 15 minutes before closing the market, it will check RSI and decided if it will open an position. This strategy do not define a stop loss. If the take profit reach the entry price it will close at market the position. The same happens if the maximal number of days is reached. It is created to brazilian people, so all configuration are in portuguese. Sorry Activations allowed have been set to 50.
New Product Description for MadoCryptoXPro --- MadoCryptoXPro — The Smartest Crypto Warrior ️ Battle-tested on BTC & ETH. Built for real-time chaos. --- MadoCryptoXPro isn’t just another technical bot. It’s a battlefield machine designed to handle the madness of BTCUSD and ETHUSD with surgical precision. Whether the market is flat, trending, or just plain psycho — it stays focused, adapts fast, and protects your capital like a vault guard on Red Bull. --- Core Features: Smart
Ultimate Boom and Crash Indicator The Ultimate Boom and Crash Indicator is a cutting-edge tool developed by  Coetsee Digital , designed to identify potential spike opportunities in the market. Crafted for traders focusing on Deriv and Weltrade synthetic markets, this indicator is optimized to operate exclusively on the 3-minute (M3), 5-minute (M5), 15-minute (M15), 30-minute (M30), and 1-hour (H1) timeframes and supports only the following pairs: PainX 1200, PainX 999, PainX 800, PainX 600, Pai
The indicator detects divergence signals - the divergences between the price peaks and the MACD oscillator values. The signals are displayed as arrows in the additional window and are maintained by the messages in a pop-up window, e-mails and push-notifications. The conditions which formed the signal are displayed by lines on the chart and in the indicator window. The indicator parameters MacdFast - fast MACD line period MacdSlow - slow MACD line period MacdSignal - MACD signal line period Macd
BladeScalper Premium MT5
Christophe Pa Trouillas
5 (2)
Obtenez les meilleurs signaux de retournement   |   Optimisez statistiques du taux de gain   |   Obtenez les Zones que le prix va tester Indicateur qui ne retrace/repeint pas, sans retard - idéal pour le trading manuel et automatisé - adapté à tous les actifs et à toutes les unités de temps 69$ pour le lancement - puis retour à >>  149$ Après votre achat,  contactez-moi sur ce canal  pour obtenir les réglages recommandés. Version   МТ4   -  МТ5   | Découvrez notre  global MetaMethod  pour maxim
Noize Absorption Index - is the manual trading system that measures the difference of pressure between bears forces and bulls forces. Green line - is a noize free index that showing curent situation. Zero value of index shows totally choppy/flat market.Values above zero level shows how powerfull bullish wave is and values below zero measures bearish forces.Up arrow appears on bearish market when it's ready to reverse, dn arrow appears on weak bullish market, as a result of reverse expectation.
MACD Pro Master
Itumeleng Mohlouwa Kgotso Tladi
MACD Pro Master The MACD Pro Master is your ultimate trading companion, designed to revolutionize your financial journey and unlock the doors to wealth. Here's why it's the next best thing since sliced bread: Advantages Precision Trading : The MACD Pro Master leverages the powerful Moving Average Convergence Divergence (MACD) indicator to provide accurate buy and sell trades,  ensuring you capitalize on every market opportunity. Customizable Settings : Tailor the trading strategy to your unique
Quantum Flux Oscillator
AL MOOSAWI ABDULLAH JAFFER BAQER
Master Market Trends with the Quantum Flux Oscillator Unlock a new level of trading precision with the Quantum Flux Oscillator, a professional-grade indicator for MetaTrader 5 designed to identify and capitalize on market momentum. Stop guessing the direction of the trend and start making informed decisions based on a clear, powerful, and mathematically sound tool. For just $30, you can add this indispensable oscillator to your trading arsenal. The Logic Behind the Oscillator The Quantum Flux O
This indicator is a zero-lag indicator and displays  strength of trend change . True Trend  Oscillator Pro works best in combination with True Trend Moving Average Pro that displays exact trend as is. Oscillator value is exact price change in given direction of the trend. True Trend Moving Average Pro: https://www.mql5.com/en/market/product/103586 If you set PERIOD input parameter to 1 this indicator becomes a sharpshooter for binary options. Developers can use True Trend Oscillator in Exper
FREE
General Description In the simplest terms this is a contrarian intra-day scalping system. Built to try and let correct trades run as far as possible and flip the trade when indicated. The indicator looks at historical daily trading ranges to lay out levels at which it takes long and short positions based on the statistical levels. The indicator is built around index futures, mainly around S&P and the DOW but can be used an any futures contract mainly using AMP Futures to trade. The indicator is
Nemesisfx boom and crash
Shandrey Naswil Petersen
trade boom and crash with trend arrows no repaint arrows direction of use  if you buy boom stoploss below arrow  if you sell crash stoploss above arrow please note that you need to follow trend to have perfect trades only use on m15   allow candles to close before taking trades please make sure you find this indicator useful as it has a 80% win rate on m15 h1 and h4 make good trades
Les acheteurs de ce produit ont également acheté
Si vous achetez cet indicateur, vous recevrez mon Gestionnaire de Trading Professionnel + EA  GRATUITEMENT. Tout d'abord, il convient de souligner que ce système de trading est un indicateur non repeint, non redessiné et non retardé, ce qui le rend idéal pour le trading manuel et automatisé. Cours en ligne, manuel et téléchargement de préréglages. Le "Système de Trading Smart Trend MT5" est une solution de trading complète conçue pour les traders débutants et expérimentés. Il combine plus de 10
Divergence Bomber
Ihor Otkydach
4.9 (79)
Chaque acheteur de cet indicateur reçoit également gratuitement : L’outil exclusif « Bomber Utility », qui accompagne automatiquement chaque opération de trading, fixe les niveaux de Stop Loss et de Take Profit, et clôture les positions selon les règles de la stratégie Des fichiers de configuration (set files) pour adapter l’indicateur à différents actifs Des set files pour configurer le Bomber Utility selon différents modes : « Risque Minimum », « Risque Équilibré » et « Stratégie d’Attente » U
Entry In The Zone and SMC Multi Timeframe est un outil d’analyse de marché en temps réel développé sur la base des Smart Money Concepts (SMC). Il est conçu pour aider les traders à analyser la structure du marché de manière systématique et à obtenir une vision plus claire de la direction globale du marché. Le système analyse automatiquement les Points de Retournement, les Zones Clés et la Market Structure sur plusieurs unités de temps, tout en affichant les Points of Interest (POI), les signaux
Obtenez l’indicateur AUX GRATUIT et le support EA   Téléchargement direct — Cliquez ici [ D.I.C.E ] The DICE Indicator  Divergence in Chaos Environment est un outil MT5 spécialisé conçu pour les traders appliquant la théorie des vagues d’Elliott dans le cadre des techniques de Trading Chaos. Il identifie les divergences cachées et régulières du prix, synchronisées avec l’environnement de marché chaotique décrit par Bill Williams. Caractéristiques clés Divergence alignée sur les vagues d’Elliott
Atomic Analyst MT5
Issam Kassas
4.19 (27)
Tout d'abord, il convient de souligner que cet indicateur de trading n'est ni repainting, ni redrawing et ne présente aucun délai, ce qui le rend idéal à la fois pour le trading manuel et automatisé. Manuel de l'utilisateur : réglages, entrées et stratégie. L'Analyste Atomique est un indicateur d'action sur les prix PA qui utilise la force et le momentum du prix pour trouver un meilleur avantage sur le marché. Équipé de filtres avancés qui aident à éliminer les bruits et les faux signaux, et à
Quantum Trend Sniper
Bogdan Ion Puscasu
4.74 (53)
Présentation       Quantum Trend Sniper Indicator   , l'indicateur révolutionnaire MQL5 qui transforme la façon dont vous identifiez et négociez les inversions de tendance ! Développé par une équipe de traders expérimentés avec une expérience commerciale de plus de 13 ans,       Indicateur Quantum Trend Sniper       est conçu pour propulser votre parcours de trading vers de nouveaux sommets grâce à sa manière innovante d'identifier les inversions de tendance avec une précision extrêmement élevée
PZ Swing Trading MT5
PZ TRADING SLU
5 (5)
Protect against whipsaws: revolutionize your swing trading approach Swing Trading is the first indicator designed to detect swings in the direction of the trend and possible reversal swings. It uses the baseline swing trading approach, widely described in trading literature. The indicator studies several price and time vectors to track the aggregate trend direction and detects situations in which the market is oversold or overbought and ready to correct. [ Installation Guide | Update Guide | Tro
Azimuth Pro
Ottaviano De Cicco
5 (1)
LAUNCH PROMO Azimuth Pro price is initially set at 299$ for the first 100 buyers. Final price will be 499$ . THE DIFFERENCE BETWEEN RETAIL AND INSTITUTIONAL ENTRIES ISN'T THE INDICATOR — IT'S THE LOCATION. Most traders enter at arbitrary price levels, chasing momentum or reacting to lagging signals. Institutions wait for price to reach structured levels where supply and demand actually shift. Azimuth Pro maps these levels automatically: swing-anchored VWAP, multi-timeframe structure lines, an
SuperScalp Pro
Van Minh Nguyen
5 (1)
SuperScalp Pro – Système d’indicateur de scalping avancé multi-filtres SuperScalp Pro est un système d’indicateur de scalping avancé qui combine le Supertrend classique avec plusieurs filtres de confirmation intelligents. L’indicateur fonctionne efficacement sur toutes les unités de temps de M1 à H4 et est particulièrement adapté à XAUUSD, BTCUSD et aux principales paires Forex. Il peut être utilisé comme système autonome ou intégré de manière flexible dans des stratégies de trading existantes.
FX Power MT5 NG
Daniel Stein
5 (29)
FX Power : Analysez la force des devises pour des décisions de trading plus intelligentes Aperçu FX Power est l'outil essentiel pour comprendre la force réelle des principales devises et de l'or, quelles que soient les conditions du marché. En identifiant les devises fortes à acheter et les faibles à vendre, FX Power simplifie vos décisions de trading et révèle des opportunités à forte probabilité. Que vous suiviez les tendances ou anticipiez les retournements à l'aide de valeurs extrêmes de D
Super Signal – Skyblade Edition Système de signaux de tendance professionnel sans repaint / sans latence, avec un taux de réussite exceptionnel | Pour MT4 / MT5 Il fonctionne mieux sur des unités de temps inférieures, comme 1 minute, 5 minutes et 15 minutes. Caractéristiques principales : Super Signal – Skyblade Edition est un système de signaux intelligent conçu spécifiquement pour le trading de tendance. Il utilise une logique de filtrage multicouche pour détecter uniquement les mouvements d
Trend indicator AI mt5
Ramil Minniakhmetov
5 (13)
L'indicateur Trend Ai est un excellent outil qui améliorera l'analyse du marché d'un trader en combinant l'identification des tendances avec des points d'entrée exploitables et des alertes d'inversion. Cet indicateur permet aux utilisateurs de naviguer dans les complexités du marché forex avec confiance et précision Au-delà des signaux primaires, l'indicateur Trend Ai identifie les points d'entrée secondaires qui surviennent lors des retraits ou des retracements, permettant aux traders de capit
Grabber System MT5
Ihor Otkydach
4.81 (21)
Je vous présente un excellent indicateur technique : Grabber, qui fonctionne comme une stratégie de trading "tout-en-un", prête à l'emploi. En un seul code sont intégrés des outils puissants d'analyse technique du marché, des signaux de trading (flèches), des fonctions d'alerte et des notifications push. Chaque acheteur de cet indicateur reçoit également gratuitement : L'utilitaire Grabber : pour la gestion automatique des ordres ouverts Un guide vidéo étape par étape : pour apprendre à installe
Quantum TrendPulse
Bogdan Ion Puscasu
5 (20)
Présentation de   Quantum TrendPulse   , l'outil de trading ultime qui combine la puissance de   SuperTrend   ,   RSI   et   Stochastic   dans un seul indicateur complet pour maximiser votre potentiel de trading. Conçu pour les traders qui recherchent précision et efficacité, cet indicateur vous aide à identifier les tendances du marché, les changements de dynamique et les points d'entrée et de sortie optimaux en toute confiance. Caractéristiques principales : Intégration SuperTrend :   suivez f
Gold Sniper Scalper Pro
Ich Khiem Nguyen
3.5 (8)
Gold Sniper Scalper Pro est un indicateur professionnel pour MetaTrader 5, conçu pour aider les traders à identifier les points d'entrée et à gérer les risques de manière efficace. L'indicateur fournit un ensemble d'outils d'analyse complet comprenant un système de détection de signaux, une gestion automatique Entry/SL/TP, une analyse de volume et des statistiques de performance en temps réel. Guide d'utilisation pour comprendre le système   |   Guide d'utilisation pour d'autres langues FONCT
L'indicateur « Dynamic Scalper System MT5 » est conçu pour la méthode de scalping, permettant de trader au sein des vagues de tendance. Testé sur les principales paires de devises et l'or, il est compatible avec d'autres instruments de trading. Fournit des signaux pour l'ouverture de positions à court terme le long de la tendance, avec un support supplémentaire pour les fluctuations de prix. Principe de l'indicateur : De grandes flèches déterminent la direction de la tendance. Un algorithme de
MetaForecast M5
Vahidreza Heidar Gholami
5 (3)
MetaForecast prédit et visualise l'avenir de n'importe quel marché en se basant sur les harmoniques des données de prix. Bien que le marché ne soit pas toujours prévisible, s'il y a un motif dans les prix, MetaForecast peut prédire l'avenir aussi précisément que possible. Comparé à d'autres produits similaires, MetaForecast peut générer des résultats plus précis en analysant les tendances du marché. Paramètres d'entrée Past size (Taille passée) Spécifie le nombre de barres que MetaForecast util
Présentation de l'indicateur astronomique pour   MT4 / MT5 : Votre compagnon de trading céleste ultime Êtes-vous prêt à élever votre expérience de trading à des hauteurs célestes ? Ne cherchez pas plus loin que notre indicateur astronomique révolutionnaire pour MT4. Cet outil innovant transcende les indicateurs de trading traditionnels en exploitant des algorithmes complexes pour vous fournir des aperçus astronomiques inégalés et des calculs de précision. Un univers d'informations à portée de ma
Market Structure Patterns
Samuel Manoel De Souza
4.47 (19)
Disponible pour   MT4   et   MT5 . Rejoignez le canal Market Structure Patterns pour télécharger des documents d'étude et/ou des informations supplémentaires. Articles connexes : Market Structure Patterns - Introduction Obtenez-le maintenant avec 50 % de réduction | Prix précédent 90 $ | Offre valable jusqu’au 31 décembre | Une mise à jour majeure arrive bientôt et le prix d’origine sera ajusté. Market Structure Patterns   est un indicateur basé sur les   Smart Money Concepts   qui affiche le
Trade smarter, not harder: Empower your trading with Harmonacci Patterns This is arguably the most complete harmonic price formation auto-recognition indicator you can find for the MetaTrader Platform. It detects 19 different patterns, takes fibonacci projections as seriously as you do, displays the Potential Reversal Zone (PRZ) and finds suitable stop-loss and take-profit levels. [ Installation Guide | Update Guide | Troubleshooting | FAQ | All Products ] It detects 19 different harmonic pri
ARIPoint
Temirlan Kdyrkhan
1 (1)
ARIPoint is a powerful trading companion designed to generate high-probability entry signals with dynamic TP/SL/DP levels based on volatility. Built-in performance tracking shows win/loss stats, PP1/PP2 hits, and success rates all updated live. Key Features: Buy/Sell signals with adaptive volatility bands Real-time TP/SL/DP levels based on ATR Built-in MA Filter with optional ATR/StdDev volatility Performance stats panel (Success, Profit/Loss, PP1/PP2) Alerts via popup, sound, push, or email Cu
Trend Forecaster
Alexey Minkov
5 (7)
The Trend Forecaster indicator utilizes a unique proprietary algorithm to determine entry points for a breakout trading strategy. The indicator identifies price clusters, analyzes price movement near levels, and provides a signal when the price breaks through a level. The Trend Forecaster indicator is suitable for all financial assets, including currencies (Forex), metals, stocks, indices, and cryptocurrencies. You can also adjust the indicator to work on any time frames, although it is recommen
Shock Pullback
Suleiman Alhawamdah
5 (1)
Tout simplement, vous pouvez commencer à trader lorsque le mouvement des chiffres blancs — appelés « pips » — commence à apparaître à côté de la bougie actuelle. Les « pips » blancs indiquent qu’un ordre d’achat ou de vente est actuellement actif et évolue dans la bonne direction, comme le montre leur couleur blanche. Lorsque le mouvement des pips blancs s’arrête et devient vert statique, cela signale la fin de la dynamique en cours. La couleur verte des chiffres représente le profit total réal
Tout d'abord, il convient de souligner que cet outil de trading est un indicateur non repeint, non redessiné et non retardé, ce qui le rend idéal pour le trading professionnel. Cours en ligne, manuel utilisateur et démonstration. L'indicateur Smart Price Action Concepts est un outil très puissant à la fois pour les nouveaux et les traders expérimentés. Il regroupe plus de 20 indicateurs utiles en un seul, combinant des idées de trading avancées telles que l'analyse du trader Inner Circle et le
Indicateur unique qui met en œuvre une approche professionnelle et quantitative pour signifier le trading de réversion. Il capitalise sur le fait que le prix dévie et revient à la moyenne de manière prévisible et mesurable, ce qui permet des règles d'entrée et de sortie claires qui surpassent largement les stratégies de trading non quantitatives. [ Installation Guide | Update Guide | Troubleshooting | FAQ | All Products ] Des signaux de trading clairs Étonnamment facile à échanger Couleurs et t
TPSproTREND PrO MT5
Roman Podpora
4.74 (19)
TPSproTrend PRO identifie le moment précis où le marché change de direction et constitue un point d'entrée au début du mouvement. Vous entrez sur le marché lorsque le prix commence tout juste à bouger, et non après que le mouvement ait déjà eu lieu.   Indicateur       Il ne redessine pas les signaux et affiche automatiquement les points d'entrée, le Stop Loss et le Take Profit, rendant ainsi le trading clair, visuel et structuré. INSTRUCTIONS RUS   -   VERSION MT4 Principaux avantages Signalisa
Golden Spike Premium
Kwaku Bondzie Ghartey
5 (1)
Golden Spikes Indicator Technical indicator for synthetic indices trading on M1 timeframe. Compatible with Boom/Crash indices on Deriv platform and Gain/Pain indices on Weltrade platform. send me A private  message to receive trade ASISTANT EA.. booklet guide:  https://drive.google.com/file/d/1knQJqGHZSP5eQN24ndRz2ayZVCst6XhN/view?usp=sharing Also check my premium spikes bot: https://www.mql5.com/en/market/product/142350 Features Uses Parabolic SAR, RSI, and Bollinger Bands analysis Three risk
FOOTPRINTORDERFLOW: The Authoritative Guide ( This indicator is also compatible with economic providers that do not offer DOM data and BID/ASK data, It also supports various foreign exchange transactions, DEMO version,modleling must choose " Every tick based on real ticks"  ) Important notice: Before placing an order, please contact me first, and I will provide you with professional answers and services 1. Overview FOOTPRINTORDERFLOW  is an advanced Order Flow analysis tool designed for MetaTra
Berma Bands
Muhammad Elbermawi
5 (7)
L'indicateur Berma Bands (BB) est un outil précieux pour les traders qui cherchent à identifier et à capitaliser sur les tendances du marché. En analysant la relation entre le prix et les BB, les traders peuvent déterminer si un marché est dans une phase de tendance ou de range. Visitez le [ Berma Home Blog ] pour en savoir plus. Les bandes de Berma sont composées de trois lignes distinctes : la bande de Berma supérieure, la bande de Berma moyenne et la bande de Berma inférieure. Ces lignes sont
FX Volume MT5
Daniel Stein
4.76 (25)
FX Volume : Découvrez le Sentiment du Marché tel que perçu par un Courtier Présentation Rapide Vous souhaitez faire passer votre approche de trading au niveau supérieur ? FX Volume vous fournit, en temps réel, des informations sur la manière dont les traders particuliers et les courtiers sont positionnés—bien avant la publication de rapports retardés comme le COT. Que vous visiez des gains réguliers ou recherchiez simplement un avantage plus solide sur les marchés, FX Volume vous aide à repére
Plus de l'auteur
The indicator displays the moment the price reaches an extreme level, including an invisible one (due to screen size limitations). Even small peaks and bottoms are considered extreme points. The level is shown as a trend line extending for a distance from the current candle (bar) to the left. The level has two values: distance (in bars) for the extreme point in a straight line to the left and distance (in bars) from the current candle (bar) to the extreme point (see the screenshots). The indicat
Индикатор виртуального эквити, представляемый здесь, может работать по нескольким символам одновременно. Для каждого символа задается направление ( Buy/Sell ) и размер позиции. В настройках также указывается размер предполагаемого депозита, дата открытия и закрытия позиции.   На графике при этом устанавливаются вертикальные линии, обозначающие указываемые в настройках даты.  После установки индикатора на график, можно изменять время открытия и закрытия позиции, передвигая эти линии.   Дату закр
Индикатор показывает расстояние от ближайшего свободного High/Low  текущей (здесь и далее, текущей - в рамках расчетов индикатора) до исследуемой    (опять же - в рамках расчетов индикатора) свечи слева на графике на том же ценовом уровне.        Свободным в данном случае будет являться расстояние больше, чем одна свеча (бар) от текущей          свечи до исследуемой на том же ценовом уровне. Расстояние будет отмечаться пунктирной линией            от High/Low текущей свечи до исследуемой.  М
TickDelta
Andrey Gladyshev
The TickDelta indicator shows the difference in the number of oscillations of the best prices per unit of time. In this case, the unit of time is the specified timeframe (M1, M2, M5, M15, etc.). This value indirectly shows the market "sentiment". Due to the "tick-wise" nature, the indicator is more appropriate for use in scalping strategies. When applied in conjunction with real volumes and monitoring of various instrument charts, it is possible to identify certain reversal setups. In some cases
Индикатор работает только с реальными биржевыми тиковыми данными. Для вычислений используются тики BID ASK и данные с ленты сделок . Индикатор проверялся на бирже CME на инструментах с узким и стабильным спредом ( S&P500, NASDAQ, CLE и др.), пояснения на скринах.   Исполнение индикатора в виде кластера в правой части графика. Каждому ценовому уровню графика выбранного участка между линиями (или отдельной свечи) соответствует полоска кластера, окрашенная в удобный для пользователя цвет (по умол
Индикатор показывает настроение слабой стороны и может использоваться как для внутридневной торговли, так и для скальпинга. Всё будет зависеть от контекста графика.   Этот индикатор строит ценовой график в виде блоков (вертикальных прямоугольников, занимающих три ценовых уровня каждый), чем-то напоминающих ренко бары. Принцип построения основан на определённом изменении уровней BID и ASK (пояснения на скрине). При установке индикатора основной график становится невидимым и на белом поле происх
Filtrer:
Aucun avis
Répondre à l'avis