KT Risk Reward MT4
- Indicadores
-
KEENBASE SOFTWARE SOLUTIONS
 Keenbase Trading desarrolla indicadores profesionales y Asesores Expertos (Expert Advisors) para MetaTrader 4 y MetaTrader 5, diseñados para ayudar a los traders a tomar decisiones de trading más informadas.
 - Versión: 1.0
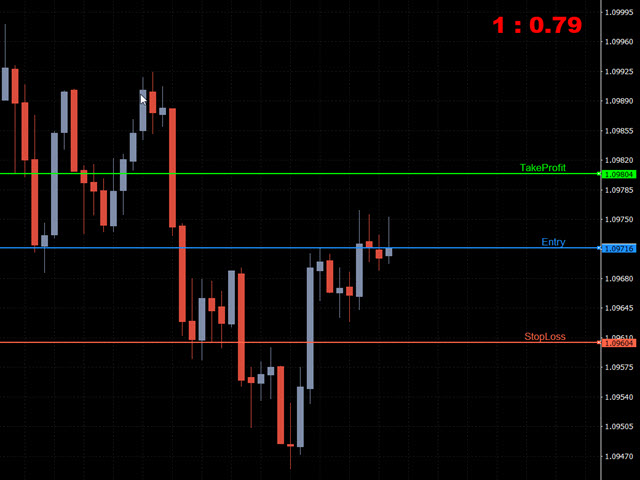
KT Risk Reward muestra la relación riesgo-recompensa comparando la distancia entre el nivel de stop-loss/take-profit y el nivel de entrada. La relación riesgo-recompensa, también conocida como relación R/R, es una medida que compara el beneficio potencial de la operación con la pérdida y se representa como una relación.
Evalúa la recompensa (take-profit) de una operación comparando el riesgo (stop loss) que conlleva. La relación entre los valores de riesgo-recompensa arroja otro valor que determina si merece la pena realizar una operación o no.
Características
- Una herramienta muy práctica para conocer rápidamente la relación riesgo-recompensa por adelantado antes de abrir una posición de negociación.
- Permite identificar rápidamente el nivel de entrada sincronizándolo con el precio actual.
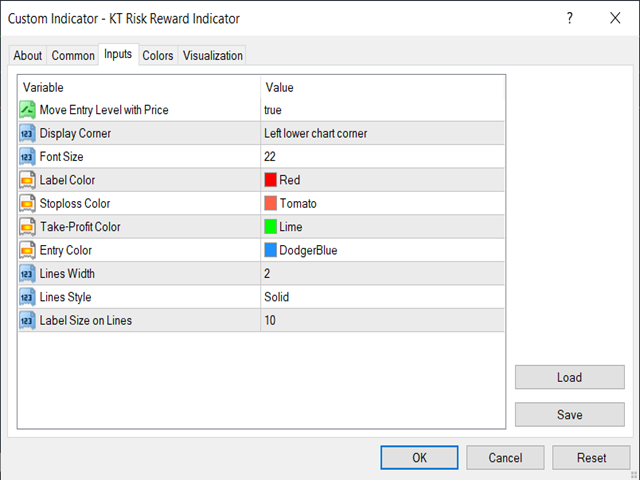
- Totalmente personalizable, es decir, puede cambiar el tamaño de la fuente, los colores y la esquina del gráfico para mostrar la relación riesgo-recompensa.
Fórmula utilizada
Relación Riesgo-Recompensa = (Precio de entrada ~ Precio Stop-loss) / (Toma de beneficios ~ Precio de entrada)
El signo '~' representa la diferencia entre dos valores, donde siempre restamos el valor más alto con el más bajo.
El signo '~' representa la diferencia entre dos valores, donde siempre restamos el valor más alto con el más bajo.
Cómo utilizar la herramienta KT Risk Reward
Cuando se aplica en el gráfico, trazará las líneas de entrada, stop loss y take profit. Debe hacer coincidir estas líneas con los niveles reales de la posición de negociación para obtener la relación riesgo-recompensa.