TBP All in One And Scanner MT5
- Indicadores
-
Dmitry Fedoseev
 Новый вариант эксперта exp_iCustom - exp_iCustomNew в маркете: https://www.mql5.com/ru/market/product/5660
 - Versión: 1.0
- Activaciones: 5
Todos los patrones del libro "The Complete Encyclopedia of Chart Price Patterns" de Thomas N. Bulkowski en un indicador con escáner.
El escáner se activa mediante el parámetro ScannerMode.
Cuando ScannerMode=false, el indicador busca un patrón (seleccionado por la variable Pattern). Cuando se detecta un patrón, el indicador dibuja una flecha, abre una ventana de mensaje y realiza una notificación push.
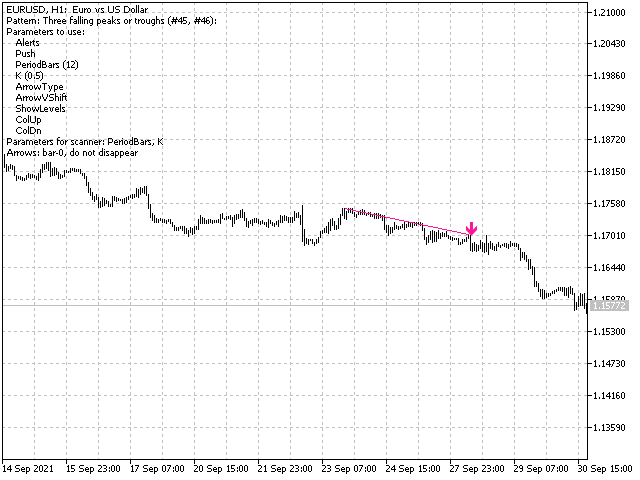
El indicador tiene muchos parámetros, algunos de ellos se usan siempre, otros se usan selectivamente. Active la variable ShowHelp - el gráfico mostrará una pista sobre los parámetros del patrón seleccionado (ver imagen 1):
- nombre del patrón, su(s) número(s) en el libro;
- parámetros utilizados;
- parámetros para el escáner;
- tipo de aparición de la flecha:
- "barra-0, no desaparece" - en la barra de formación, no desaparece;
- "barra-0, puede desaparecer, espere nueva barra" - en la barra de formación, puede desaparecer, espere nueva barra.
Con los parámetros por defecto algunos patrones no son reconocidos, por lo que el valor recomendado se da entre paréntesis (estos valores no se recomiendan para el comercio).
Para el escáner, primero debe preparar un archivo con la lista de patrones. El archivo se puede crear en el programa notepad (utilice la codificación UTF-16LE). Una línea - un patrón. Los campos de una línea están separados por punto y coma ";". El primer campo - nombre del patrón (como en la lista desplegable Patrón), el segundo - símbolo, el tercero - marco temporal (M1, M2, M3, M4, M5, M6, M10, M12, M15, M20, M30, H1, H2, H3, H4, H6, H8, H12, D1, W1, MN1). Luego vienen los parámetros del patrón.
Un ejemplo de un par de líneas del archivo:
_CHnS; EURUSD; H1; 12; 0.25; 1; 1; 1; 1; 1
Utilice 1 (verdadero) y 0 (falso) para la variable bool.
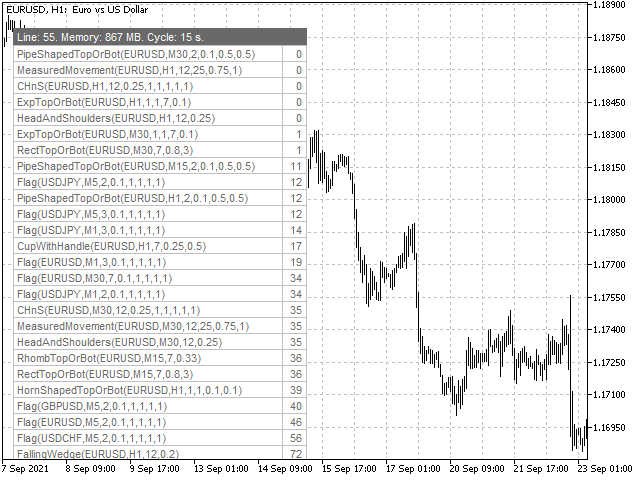
El escáner muestra un panel gráfico (ver imagen 2). La línea superior del panel: número de línea del archivo, la cantidad de RAM utilizada, la duración de un ciclo de visualización. Luego vienen las líneas con el nombre del patrón y los parámetros. La columna de la derecha muestra el número de barras que han pasado desde el momento en que se detectó el patrón. Haga clic en la línea para abrir el gráfico correspondiente.
El grupo de parámetros hasta el parámetro ScannerMode se utiliza cuando ScannerMode=false (sólo los parámetros Alerts y Push se utilizan cuando ScannerMode=true). Los parámetros por debajo de ScannerMode sólo se utilizan en modo escáner.
Todos los parámetros:
- Pattern - patrón.
- Alerts - habilitar alertas. Si las flechas no desaparecen al formarse la barra, la alerta se ejecuta inmediatamente después de que aparezca la flecha. Si la flecha puede desaparecer, la alerta se ejecuta en la apertura de la siguiente barra.
- Push - envío de una notificación Push.
- Variant1, Variant2 - variantes para el patrón ExpTopOrBot.
- BarsInsideFrom, BarsInsideAdd - parámetro para el patrón HornShapedTopOrBot. BarsInsideFrom - número mínimo de barras entre máximos, BarsInsideFrom+BarsInsideAdd-1 - número máximo de barras.
- PeriodBars - periodo del indicador.
- K, K1, K2, K3 - parámetros que afectan a la precisión del reconocimiento del patrón y la forma.
- GapSize - brecha mínima en puntos.
- Head1, Head2, Head3, Head4, Head5 - diferentes variantes del patrón HeadAndShoulders: Head1 - con una cabeza, Head2 - con dos cabezas, etc.
- AdamAdam, AdamEve, EveAdam, EveEve - variantes de DblTopOrBot.
- InclInDir, Expanding, Tapered , Parallel - variantes de Flag pattern: InclInDir - por o contra la pendiente de la bandera, Expanding - expandiéndose, Tapered - estrechándose, Parallel - paralelo.
- MinMovment, BackMovment - para el patrón MeasuredMovement. MinMovment - movimiento mínimo en puntos. BackMovment - valor del movimiento hacia atrás (en fracciones de una unidad).
- VertexCount - número de vértices/vértices: 2, 3, 4 (para RectTopOrBot).
- ArrowType - icono (1-17).
- ArrowVShift - desplazamiento de los iconos en píxeles.
- ShowLevels, ShowFlag - dibujar patrón con objetos gráficos.
- ColUp, ColDn, Color - color para dibujar patrones arriba, abajo, independientemente de las direcciones.
- Auto5Digits - multiplica los parámetros Gap y MinMovimiento por 10 en citas de 5 y 3 dígitos.
- ShowHelp - mostrar consejos sobre los parámetros.
- ScannerMode - modo del escáner
- ScannerFile - nombre de archivo para el escáner.
- ColTxt, ColBG, ColBorder - colores del panel del escáner: ColTxt - texto, ColBG - fondo, ColBorder - marco.
- PanX, PanY - coordenadas del panel del escáner.
- StatusLine - muestra la línea superior del panel del escáner.

Excellent