AdaptiveCCiMt5
- Indicadores
- Versión: 1.1
- Actualizado: 17 julio 2020

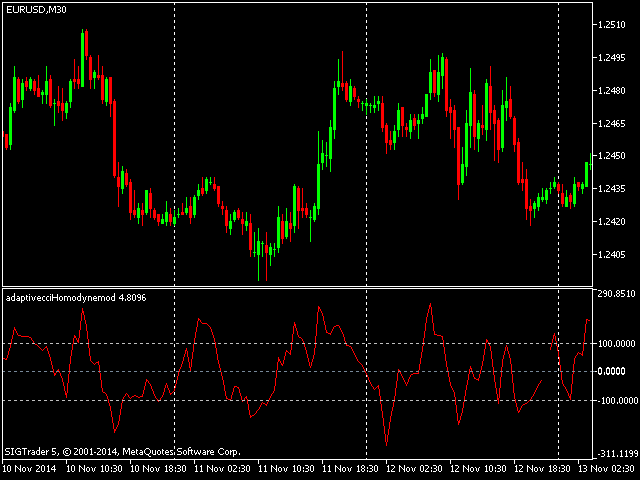
El Índice del Canal de Materias Primas calcula la desviación del precio típico de cada barra con respecto al precio medio durante un periodo de tiempo determinado. Multiplicar la desviación media por 0,015 facilita la normalización, lo que hace que todas las desviaciones por debajo de la primera desviación típica sean inferiores a -100, y que todas las desviaciones por encima de la primera desviación típica sean superiores a 100.
Esta versión adaptativa se basa en el indicador descrito por John Ehlers, en el libro Rocket Science for traders. El indicador utiliza el descriminador homodino para calcular el ciclo dominante.
Para aplicar el descriminador homodino, las partes real e imaginaria deben calcularse a partir de los componentes en fase y cuadratura (los componentes en fase y cuadratura se deducen mediante la transformada de Hilbert). Para saber más sobre esto, lea el artículo sobre Teoría e implementación de indicadores adaptativos avanzados. Las secciones sobre Números complejos y fasores para medir los ciclos del mercado y también Medición del periodo del ciclo. ) Para ello, el producto de la componente en fase actual y su valor hace una barra se suman al producto de la componente en cuadratura actual y su valor hace una barra para obtener la parte real. Para obtener la parte imaginaria, se resta el producto de la componente de Cuadratura actual y el valor de la componente de Fase hace un compás al producto de la componente de Fase actual y el valor de la componente de Cuadratura hace un compás. A continuación, se suavizan tanto la parte real como la imaginaria, antes de poder deducir el periodo del ciclo.
El ciclo se calcula tomando la arctangente de la parte imaginaria dividida por la parte real. Se imponen restricciones para garantizar que la tasa de cambio del periodo del ciclo se limita a +-50% del periodo del ciclo anterior y, además, el periodo del ciclo resultante se limita a ser mayor que 6 y menor que 50. A continuación, se aplica el suavizado por última vez al periodo de ciclo.Este valor del período del ciclo se utiliza entonces al cierre de cada barra como el valor que representa el número de barras hacia atrás que deben analizarse para producir el Índice del Canal de Materias Primas. Esto permite la naturaleza adaptativa del indicador.
Puede utilizarse como alternativa al Commodity Channel Index convencional.
Parámetros del indicador:
- El valor de los límites controla el número de barras para las que se dibujará el indicador.
- La parte del ciclo es un modificador para el periodo del ciclo calculado, ayuda a asegurarse de que el indicador permanece en fase con los datos del precio. También se puede utilizar para optimizar el indicador para el ciclo medido.


Gute Arbeit, danke für diesen Indikator.