Vegas indicador
- Indicadores
- Versión: 1.0

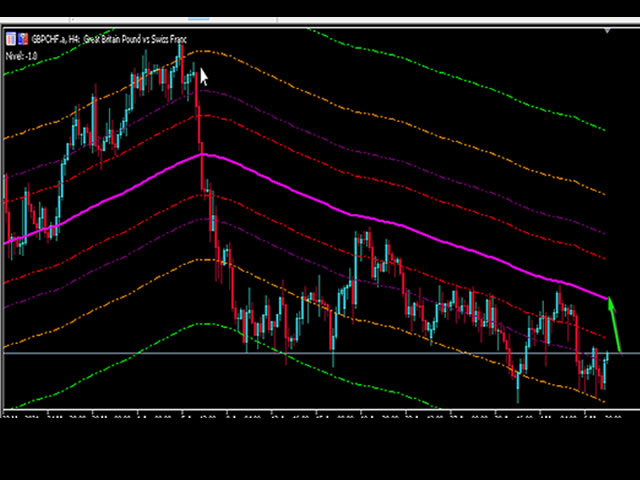
Este indicador es una buena opción para aquellos que les gusta operar a largo plazo y con paciencia.
Funciona con niveles de fibo con un promedio de 200. Hay 9 niveles en los que puede operar con retrocesos del mercado a partir de los niveles que se indican a continuación.
Nivel 1 = 550 puntos
Nivel 2 = 890 puntos
Nivel 3 = 1440 puntos
Nivel 4 = 2330 puntos
Nivel 5 = 3770 puntos
Nivel 7 = 9870 puntos
Nivel 8 = 15970 puntos
Nivel 9 = 25840 puntos
Nivel 6 = 6100 puntos


Excelente indicador! Estava justamente procurando 2 indicadores que consegui com vc. O indicador do Reinaldo Cotrim e acabei encontrando este também que é muito bom e a peça que faltava para facilitar minhas análises. Muito obrigada, sensacional!