Fully Customizable 3 Band VWAP
- Indicadores
-
Eduardo Fernando Teixeira
 Scanner da Bolsa - Software and Trading Solutions
Florianópolis, Brazil - Versión: 1.8
- Activaciones: 5
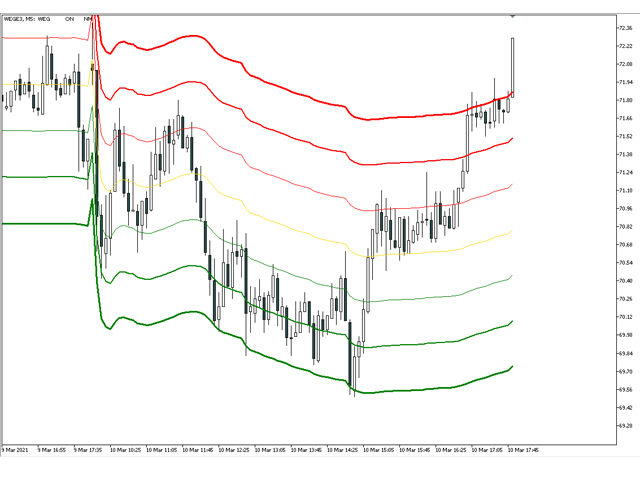
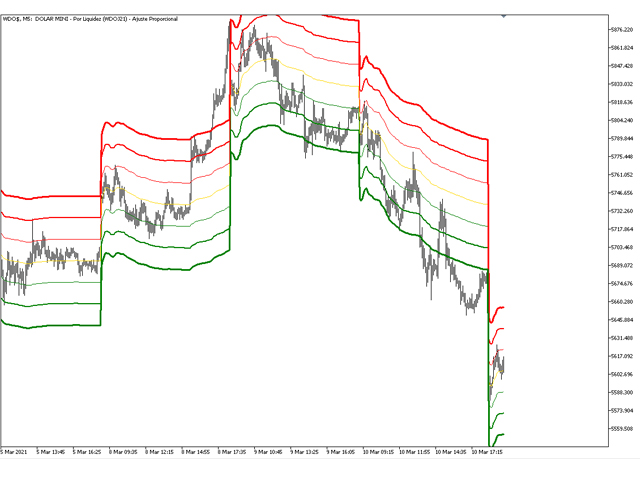
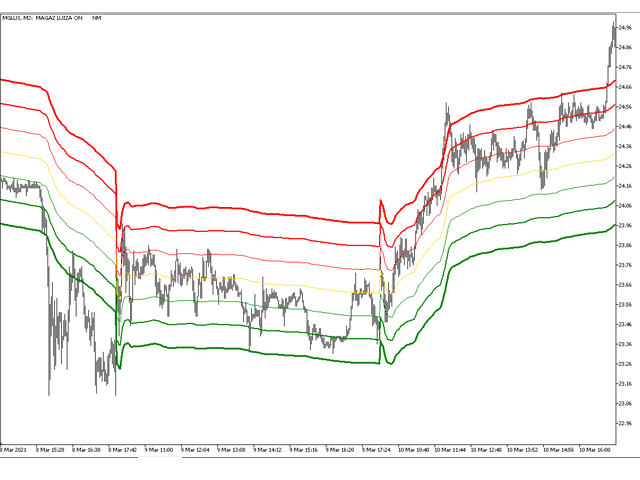
3-BANDAS VWAP (Precio medio ponderado por volumen)
Indicador de bandas VWAP totalmente personalizado y compatible con EA
CARACTERÍSTICAS PRINCIPALES:
Elija el periodo de reajuste del cálculo del VWAP (Diario, Semanal o Mensual): Para el trading diario utilice el VWAP Diario, y para el análisis a largo plazo utilice los cálculos Semanal o Mensual.
Ajuste fino de la desviación de las bandas: Encuentre la mejor desviación de la banda para los instrumentos con los que opera y ajústela en consecuencia.
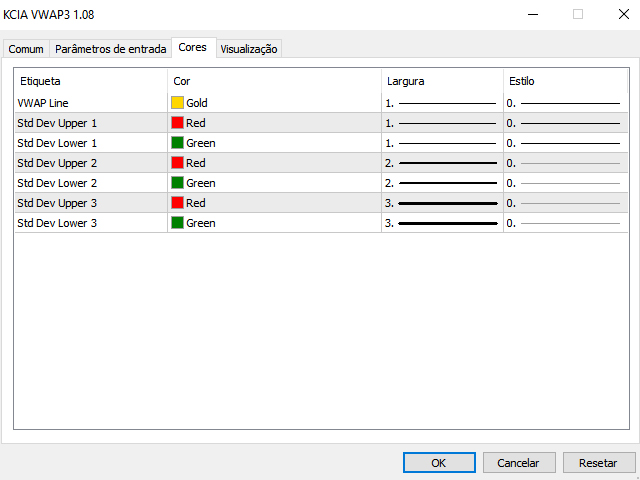
Personalice los colores, el estilo y la anchura de las líneas según sus preferencias gráficas.
FÁCIL INTEGRACIÓN CON ASESORES EXPERTOS (EA)
Fácil acceso a los datos del indicador mediante las funciones iCustom() y CopyBuffer().
GUÍA DE PARÁMETROS
Tipo de Periodo de Tiempo (Timeframe en el que se reinician los cálculos)
0= Diario
1= Semanal
2= Mensual
Mapa del Buffer del Indicador (Elija la línea a la que desea acceder)
0 = Línea principal VWAP
1 = Primera banda superior
2 = Primera banda inferior
3 = Segunda banda superior
4 = Segunda banda inferior
5 = Tercera banda superior
6 = Tercera banda inferior
Ejemplos:
// Obtener el valor actual de la línea principal (central) a partir del VWAP Diario

   double array[];

   int handle = iCustom(Symbol(),Period(),"YourIndicatorFolder\\KCIA VWAP3.ex5",0);

   CopyBuffer(handle,0,0,1,array);


// Obtener los 20 últimos valores de la 3ª banda superior del VWAP Mensual:

   double array[];

   int handle = iCustom(Symbol(),Period(),"YourIndicatorFolder\\KCIA VWAP3.ex5",2);

   CopyBuffer(handle,5,0,20,array);