Relative Strength Ratio RSR
- Indicadores
-
Eduardo Fernando Teixeira
 Scanner da Bolsa - Software and Trading Solutions
Florianópolis, Brazil - Versión: 1.3
- Activaciones: 5
Ratio de fuerza relativa (RSR)
El indicador Relative Strength Ratio (RSR) compara el rendimiento de un valor frente a otro, dividiendo el valor base por el valor comparativo y mostrando la relación de esta división en un gráfico de líneas. Este indicador también se conoce como indicador de Fuerza Rel ativa, Precio Relativo o Fuerza Relativa Comparativa.
Es una de las principales herramientas de los profesionales del Análisis Intermercado, para ayudarles a identificar Rotaciones Sectoriales y otras relaciones globales entre acciones, índices, bonos, divisas, materias primas, etc.
El Relative Strength Ratio (RSR) también puede utilizarse para medir el rendimiento relativo de una acción frente a un índice de referencia, como el S&P 500 o cualquier índice bursátil internacional. Los analistas también pueden utilizar el RSR para comparar el rendimiento relativo de una acción con su sector o grupo industrial. De este modo, se puede determinar si un valor va a la cabeza o a la zaga de sus homólogos. El indicador Ratio de Fuerza Relativa (RSR) también puede utilizarse para encontrar valores que estén resistiendo mejor durante una caída general del mercado o que muestren debilidad durante un avance general del mercado.
Atención: la Fuerza Relativa (RSR ) y el Índice de Fuerza Relativa (RSI ) son dos cosas completamente diferentes. El Índice de Fuerza Relativa es un indicador que sólo utiliza información de su propio símbolo para realizar sus cálculos, que oscilan entre 0 y 100, mientras que el Ratio de Fuerza Relativa (RSR) realiza los cálculos con datos de dos valores, como se ha mencionado anteriormente.
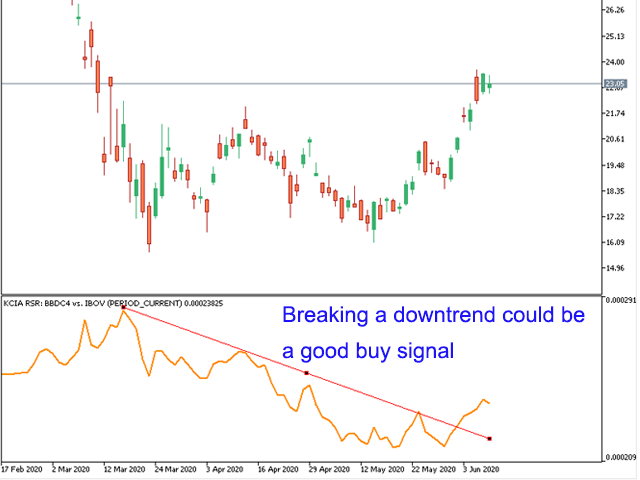
Los gestores de carteras y fondos comparan sus resultados con los de un índice de referencia, como el S&P 500. Su objetivo es superar ese índice. Su objetivo es superar a ese índice de referencia y, para lograrlo, suelen buscar valores que tengan una buena Fuerza Relativa. La línea del indicador SUBE cuando un valor muestra fortaleza relativa, por lo que está SUPERANDO al índice de referencia. Por el contrario, la línea CAE cuando un valor pierde fuerza y, por lo tanto, su rendimiento es inferior al del índice de referencia.
Los chartistas pueden realizar un sencillo análisis de tendencias para determinar la dirección del RSR. Esto se puede hacer dibujando líneas de tendencia, rupturas de soporte/resistencia, añadiendo el indicador de Media Móvil sobre él, etc. También pueden buscar divergencias alcistas y bajistas para advertir de posibles retrocesos.
Puede hacer una comparación entre dos tickers cualesquiera que Metatrader pueda cargar en el broker al que esté conectado, siempre que haya liquidez en ellos. Puede comparar una acción contra otra acción, una acción contra un índice, una divisa contra un ETF, bonos contra futuros de materias primas, ¡lo que quiera!
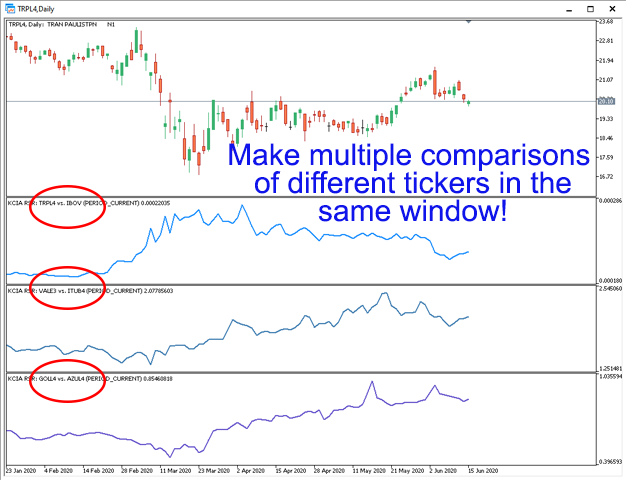
Una característica interesante de este indicador es que puede cargarlo varias veces en la misma ventana, mostrando diferentes comparaciones entre distintos valores al mismo tiempo. (Ver capturas de pantalla).
Tenga cuidado con los marcos temporales intradía al principio de una sesión, ya que los instrumentos a comparar pueden tener diferentes horas de inicio de negociación y el indicador comparará barras de diferentes horas (por ejemplo, la primera barra del día comparada con la última barra de la última sesión).
Más información sobre la fuerza relativa:
El Ratio de Fuerza Relativa (RSR) es también la base para el Análisis de Rotación Relativa y la construcción de los Gráficos de Rotación Relativa (RRG) de Julius de Kempenaer, en los que los datos brutos del Ratio de Fuerza Relativa (RSR) se utilizan para el cálculo de los valores JdK RS-Ratio y JdK RS-Momentum que luego se trazan en su gráfico cartesiano.
El análisis técnico de los mercados financieros de John Murphy incluye el análisis de la fuerza relativa en el capítulo dedicado al análisis entre mercados. Murphy también analiza la fuerza relativa de los sectores y muestra cómo aplicar la fuerza relativa a los valores individuales.
Technical Analysis Explained, de Martin Pring, incluye un capítulo sobre el concepto de fuerza relativa. Pring muestra ejemplos de gráficos para determinar la fuerza relativa y también enseña a los lectores cómo combinar la fuerza relativa con otros indicadores.
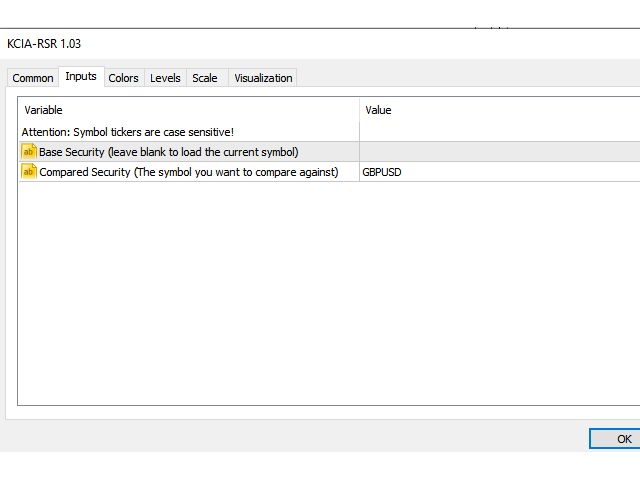
PARÁMETROS DE ENTRADA:
| Valor base | El símbolo del instrumento con el que desea comparar la fuerza relativa. Por defecto es el cargado en la ventana actual y se actualizará automáticamente si lo cambia. O puede introducir un símbolo personalizado. |
| Valor Comparado | Su valor de referencia, el valor que desea comparar. Normalmente es un índice, pero puede ser cualquier símbolo. |

Love this indicator. Also, very good support.