Donchian Channels Bands
- Indicadores
- Versión: 1.0

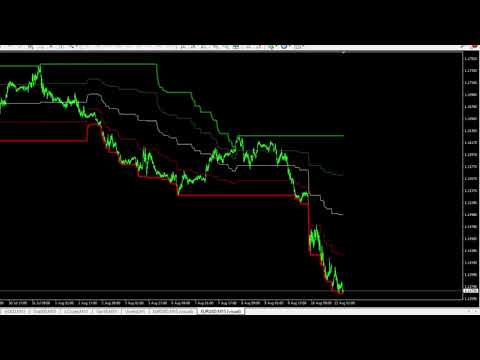
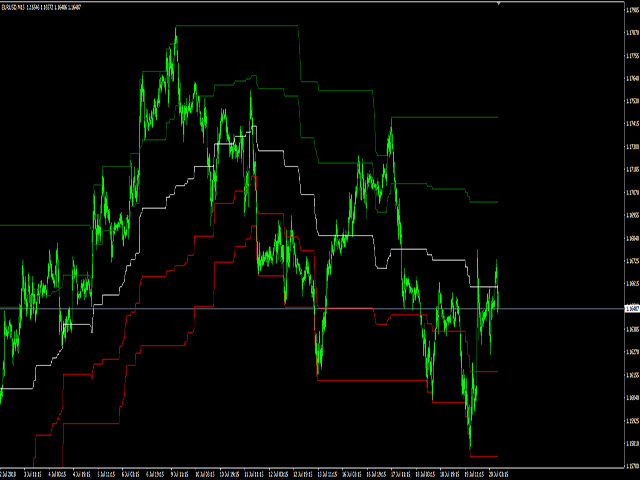
Los canales de precios, también conocidos como canales de Donchian en honor a Richard Donchian, utilizan el precio más alto y más bajo de un número determinado de periodos para crear un canal o envolvente superior e inferior alrededor del precio. El canal superior muestra el máximo del número de periodos elegido. El canal inferior muestra el mínimo del número de periodos elegido. Por ejemplo, la captura de pantalla muestra los Canales de Precios utilizando 320 periodos. El canal superior muestra el máximo de las 320 barras anteriores. El canal inferior muestra el mínimo de las 320 barras anteriores.
El uso típico es ver cuando el precio rompe los canales para crear un nuevo máximo o mínimo. Esto puede indicar el comienzo de una nueva tendencia si el precio sigue aumentando o disminuyendo. Este indicador es más conocido por el Sistema Tortuga en los mercados de futuros. Richard Dennis, William Eckhardt, Dale Dellutri y las Tortugas tenían un sistema que utilizaba los Canales de Precios en 20 barras y 10 barras y un segundo sistema que utilizaba los Canales de Precios en 55 barras y 20 barras.
Esta versión añade líneas de retroceso del 50%.


супер