Donchian Channels Bands
- Indikatoren
- Version: 1.0

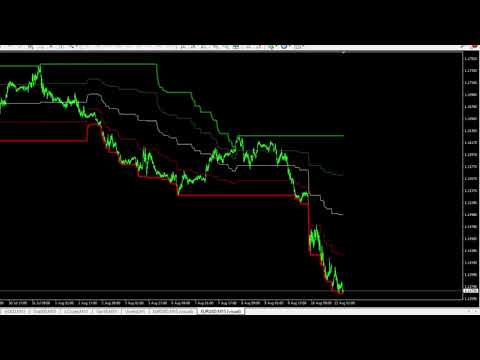
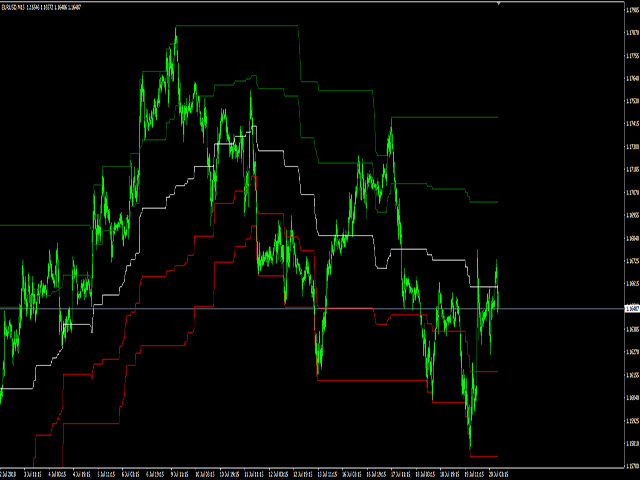
Preiskanäle sind auch als Donchian-Kanäle bekannt, benannt nach Richard Donchian. Sie verwenden den höchsten und den niedrigsten Preis einer bestimmten Anzahl von Perioden, um einen oberen und einen unteren Kanal oder Umschlag um den Preis zu erstellen. Der obere Kanal zeigt den Höchststand der gewählten Anzahl von Perioden an. Der untere Kanal zeigt den Tiefstwert der gewählten Anzahl von Perioden an. Der Screenshot zeigt zum Beispiel die Preiskanäle mit 320 Perioden. Der obere Kanal im Screenshot zeigt den höchsten Wert der letzten 320 Bars. Der untere Kanal in der Abbildung zeigt den niedrigsten Wert der vorangegangenen 320 Balken an.
In der Regel kann man sehen, wann der Kurs aus den Kanälen ausbricht und ein neues Hoch oder Tief bildet. Dies kann auf den Beginn eines neuen Trends hindeuten, wenn der Preis weiter steigt oder fällt. Dieser Indikator ist vor allem durch das Turtle-System auf den Futures-Märkten bekannt. Richard Dennis, William Eckhardt, Dale Dellutri und die Turtles hatten ein System, das die Preiskanäle bei 20 Balken und 10 Balken verwendet, und ein zweites System, das die Preiskanäle bei 55 Balken und 20 Balken verwendet.
Diese Version fügt 50% Retracement-Linien hinzu


супер