Accumulated Aggression
- Göstergeler
-
Edson Cavalca Junior
 Systems developer for over 30 years. Currently developing financial products for the Metatrader platform.
Site:
https://tinosangue.com.br
Youtube: Aprender a Investir - Sürüm: 1.20
- Güncellendi: 18 Mayıs 2021
- Etkinleştirmeler: 10
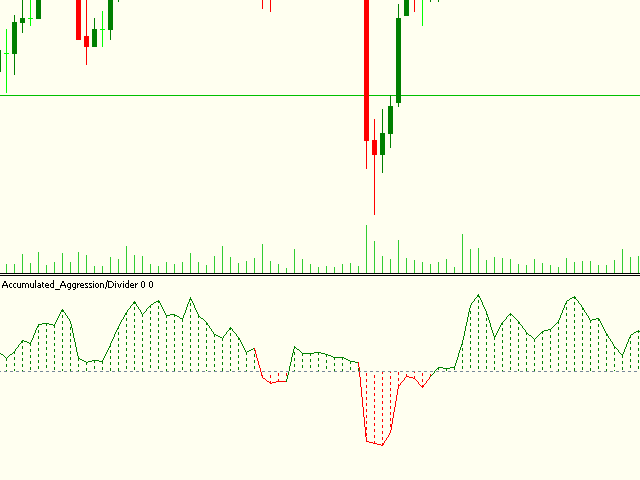
The indicator measures the accumulated balance of aggression.
The formula is as follows:
Accumulated = Previous Candle Accumulated + Purchase Volume - Sales Volume.
*** Did you like the product? Then, help us doing review in the "Reviews" tab.
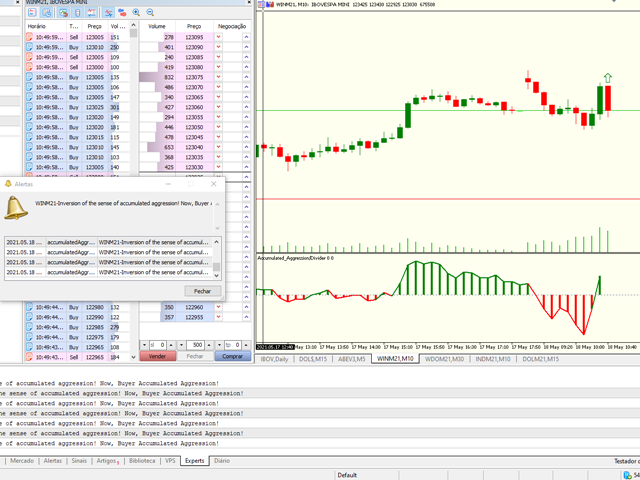
The indicator sends information to your email or cell phone when the accumulated balance changes direction.
Example: Accumulated seller becomes a buyer.
Note:
- It is recommended to use the default configuration and VPS values.
- You need trading information (Time and Sales).
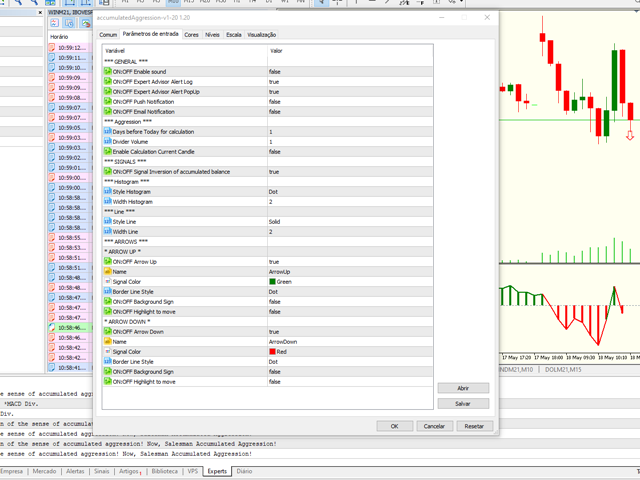
Some Parameters:
- Numbers of days prior to the current one for calculation;
- Volume Divider e;
- Enables calculation of the current candle;
Signal
- Enable accumulated aggression inversion signal.
Histogram
- Line style and;
- Size;
- Line style and;
- Size;
Follow us on our website to check the next news.
Edson Cavalca Junior
Systems Analyst