Market Thermometer Jr
- Indicadores
-
Edson Cavalca Junior
 Systems developer for over 30 years. Currently developing financial products for the Metatrader platform.
Site:
https://tinosangue.com.br
Youtube: Aprender a Investir - Versión: 1.0
- Activaciones: 5
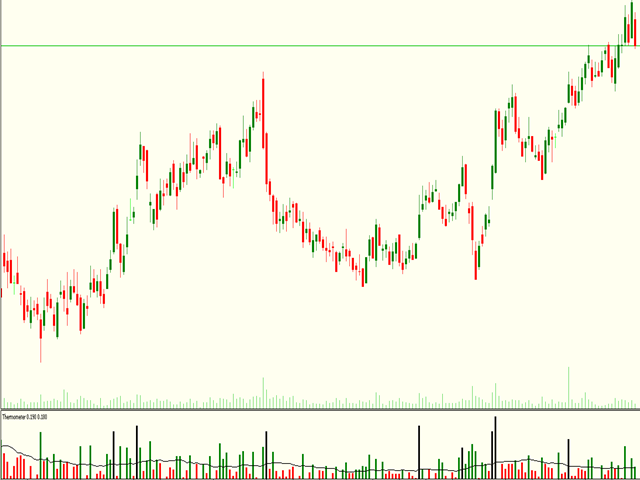
El Termómetro de Mercado puede utilizarse para ayudar a los operadores a identificar los periodos de letargo o turbulencia.
Ayuda a los principiantes a comprobar cuándo es el momento ideal para entrar en operaciones, es decir, cuando el valor del termómetro está por debajo de su media durante varios periodos, lo que identifica un mercado tranquilo.
Cuando el mercado está caldeado, es decir, el termómetro está por encima de tres veces su media, es el momento de obtener beneficios.
El Termómetro mide en qué medida el final de un periodo, precio máximo o mínimo, se proyecta fuera del rango del periodo anterior.
¿Le ha gustado el producto?Entonces, ayúdanos haciendo reseñas en la pestaña"Reseñas".
La barra del termómetro es:
- Roja: cuando el valor del termómetro está por debajo de la media;
- Verde: cuando el valor del termómetro está por encima de la media;
- Negro: cuando el valor del termómetro supera 3 veces la media;
Parámetro de entrada:
- Media aritmética del termómetro (Norma 22);
Síganos en nuestra página web para consultar las próximas novedades.
Abrazos
Edson Cavalca Junior
Analista de Sistemas

El usuario no ha dejado ningún comentario para su valoración