Horizontal Level
- Indicadores
- Versión: 1.2
- Activaciones: 5

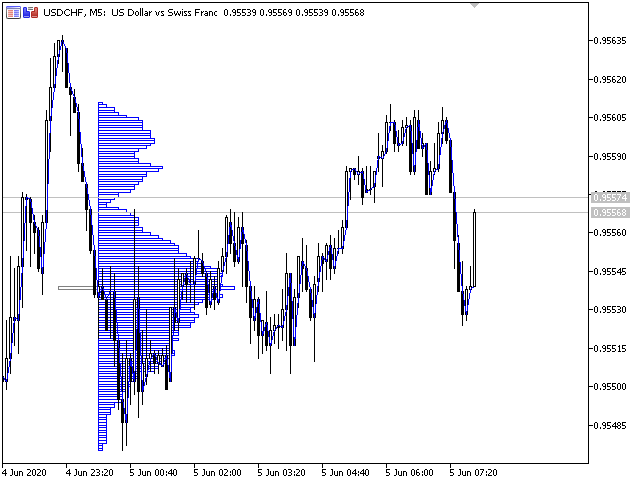
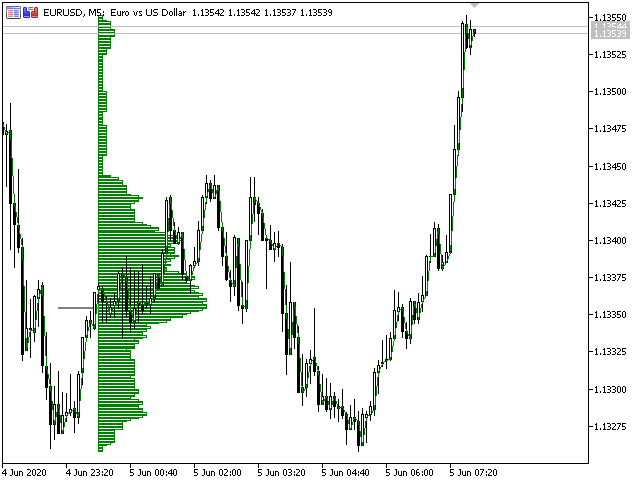
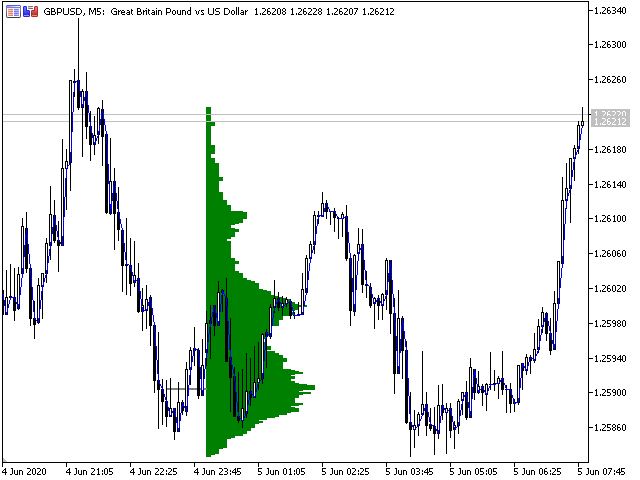
Indicador de nivel horizontal: refleja, mediante un histograma, los volúmenes horizontales de las operaciones a un precio determinado sin referencia temporal. Al mismo tiempo, el histograma aparece directamente en la ventana del terminal, y cada columna del volumen se correlaciona fácilmente con el valor de cotización del par de divisas. El volumen de transacciones es de gran importancia en el comercio de divisas, por lo general un aumento en el número de contratos celebrados confirma la tendencia, y su reducción indica una inminente inversión. Al operar en Forex, este indicador también se utiliza ampliamente, aunque las fuentes de obtención de datos son bastante dudosas, hay muchos partidarios que confirman la eficacia del uso de los volúmenes como señal para la apertura de operaciones. Es decir, gracias a él podemos concluir cómo reaccionó el mercado ante una u otra cotización, y cómo cambió el volumen en función del nivel de precios.
Estrategia de uso del indicador de volumen.
El indicador prácticamente no requiere cambiar la configuración, y si lo desea, cualquier operador puede averiguarlo. Una característica de esta herramienta es que no se centra en el tiempo, sino en un indicador de precios, es decir, muestra cuál es el precio más atractivo para compradores y vendedores. Cómo reacciona el mercado a los cambios en el tamaño de las operaciones. La forma más fácil de utilizar el indicador es abrir una operación en la dirección de la tendencia existente cuando el histograma se expande. Es decir, este hecho confirma la tendencia actual. El mejor resultado se obtiene combinando el indicador de volumen con noticias fundamentales, puede actuar como filtro de noticias, es decir, mostrar cómo reacciona el mercado ante una u otra noticia.