Todays High and Low
- Indicadores
- Versión: 1.0
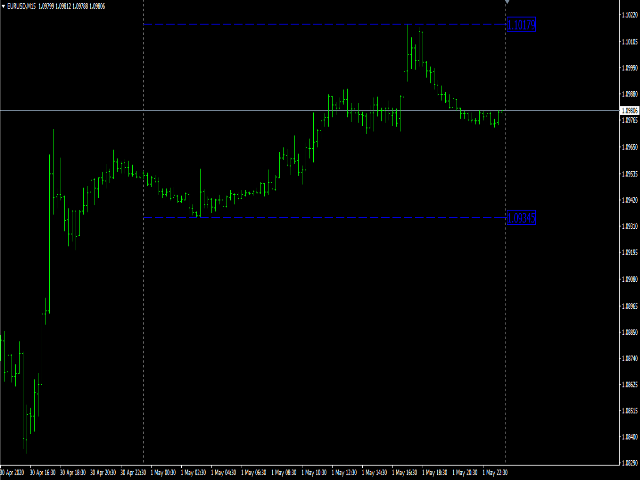
Máximo y mínimo del día
Este indicador traza líneas en el precio máximo del día y en el precio mínimo del día. Ambas líneas se terminan con etiquetas con los precios máximo y mínimo escritos. Las líneas y las etiquetas se mueven según el progreso del gráfico en tiempo real. El indicador funciona en todos los intervalos de tiempo del gráfico. Puede cambiar y establecer los colores y desplazar el gráfico. El indicador permite observar el movimiento de los precios en el gráfico y no perder de vista los máximos y mínimos alcanzados.