The Hong Kong Stock Exchange Sessions Hours
- Indicadores
- Versión: 9.0
- Actualizado: 3 junio 2021
Horas de la sesión de la Bolsa de Hong Kong
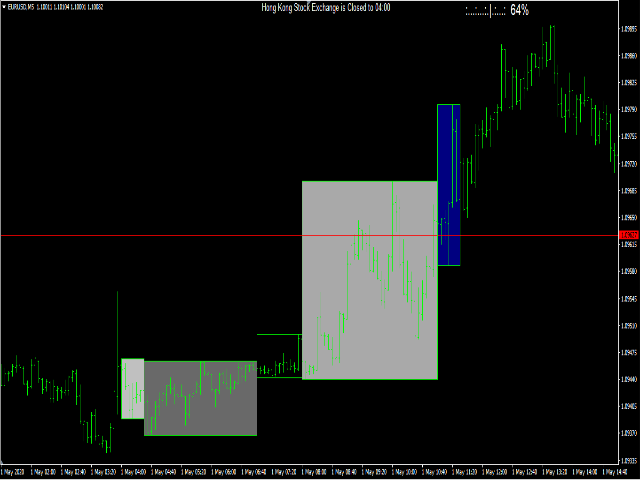
Este indicador facilita la observación de las cotizaciones del par de divisas durante las siguientes partes de la sesión bursátil en directo. Antes de que comience la sesión, se dibuja un rectángulo en el gráfico, pero no se rellena de color. Significa la extensión de la duración de la sesión. Antes de que la primera barra entre en el rectángulo de la sesión, una señal sonora o una ventana emergente nos avisará de que la sesión acaba de comenzar. Cuando el gráfico de precios cruza el borde del rectángulo de la sesión con el paso de los minutos sucesivos, el rectángulo se rellena constantemente de color. La apertura frecuente de la bolsa da un fuerte impulso al mercado de divisas y esta interfaz gráfica facilita la localización de este momento. Los rectángulos subsiguientes de otras partes de la sesión aparecen con el tiempo y la inscripción en la parte superior de la ventana del gráfico adoptará el título de la sesión actual. Al finalizar la sesión, la inscripción nos informa de que el mercado está cerrado hasta la hora indicada del día siguiente. En la primera línea de las propiedades del indicador se puede introducir cuántos días hacia atrás debe mostrar el indicador las ventanas de sesiones anteriores para comprobar su impacto en las cotizaciones de los pares de divisas. Todos los colores e inscripciones pueden ser determinados por usted mismo. Las horas de las sesiones se registran en la hora local del lugar apropiado para un determinado mercado de valores, sin embargo, debe recordar introducir la diferencia horaria actual en su hora local debido a los cambios de horario de verano e invierno en los diferentes países del mundo. Por defecto, se introducen las diferencias horarias con respecto a GMT + 1.